Supercuts 2012 Annual Report Download - page 67
Download and view the complete annual report
Please find page 67 of the 2012 Supercuts annual report below. You can navigate through the pages in the report by either clicking on the pages listed below, or by using the keyword search tool below to find specific information within the annual report.-
 1
1 -
2
-
3
-
4
-
5
-
6
-
7
-
8
-
9
-
10
-
11
-
12
-
13
-
14
-
15
-
16
-
17
-
18
-
19
-
20
-
21
-
22
-
23
-
24
-
25
-
26
-
27
-
28
-
29
-
30
-
31
-
32
-
33
-
34
-
35
-
36
-
37
-
38
-
39
-
40
-
41
-
42
-
43
-
44
-
45
-
46
-
47
-
48
-
49
-
50
-
51
-
52
-
53
-
54
-
55
-
56
-
 57
57 -
 58
58 -
 59
59 -
 60
60 -
 61
61 -
 62
62 -
 63
63 -
 64
64 -
 65
65 -
 66
66 -
 67
67 -
 68
68 -
 69
69 -
 70
70 -
 71
71 -
 72
72 -
 73
73 -
 74
74 -
 75
75 -
 76
76 -
 77
77 -
78
-
79
-
80
-
81
-
82
-
83
-
84
-
85
-
86
-
87
-
88
-
89
-
90
-
91
-
92
-
93
-
94
-
95
-
96
-
97
-
98
-
99
-
100
-
101
-
102
-
103
-
104
-
105
-
106
-
107
-
108
-
109
-
110
-
111
-
112
-
113
-
114
-
115
-
116
-
117
-
118
-
119
-
120
-
121
-
122
-
123
-
124
-
125
-
126
-
127
-
128
-
129
-
130
-
131
-
132
-
133
-
134
-
135
-
136
-
137
-
138
-
139
-
140
-
141
-
142
-
143
-
144
-
145
-
146
-
147
-
148
-
149
-
150
-
151
-
152
-
153
-
154
-
155
-
156
-
157
-
158
-
159
-
160
-
161
-
162
-
163
-
164
-
165
-
166
-
167
-
168
-
169
-
170
-
171
-
172
-
173
-
174
-
175
-
176
-
177
-
178
-
179
-
180
-
181
 |
 |

Table of Contents
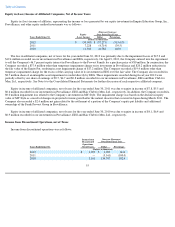
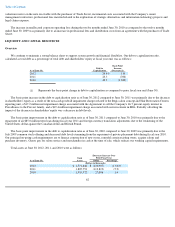
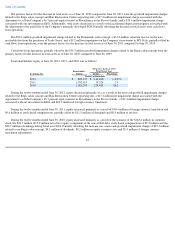
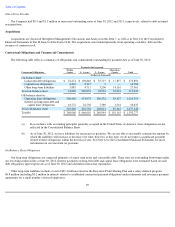
Investing Activities
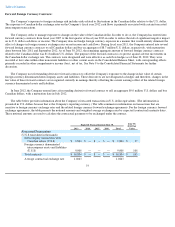
Net cash used in investing activities during the twelve months ended June 30, 2012, 2011 and 2010 was the result of the following:
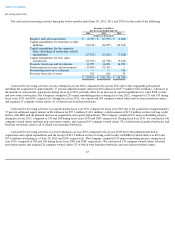
Cash used by investing activities was less during fiscal year 2012 compared to fiscal year 2011 due to the comparable prior period
including the acquisition of approximately 17 percent additional equity interest in Provalliance for $57.3 million (€40.4 million), a decrease in
the amount of cash paid for acquisitions during fiscal year 2012, partially offset by an increase in capital expenditures for a new POS system
and new salon construction. The Company completed 235 major remodeling projects during fiscal year 2012, compared to 271 and 333 during
fiscal years 2011 and 2010, respectively. During fiscal year 2012, we constructed 209 company-owned salons and six hair restoration centers,
and acquired 13 company-owned salons (11 of which were franchise buybacks).
Cash used by investing activities was greater during fiscal year 2011 compared to fiscal year 2010 due to the acquisition of approximately
17 percent additional equity interest in Provalliance for $57.3 million (€ 40.4 million), a disbursement of $15.0 million on the revolving credit
facility with EEG and the planned increase in acquisitions and capital expenditures. The Company completed 271 major remodeling projects
during fiscal year 2011, compared to 333 and 280 during fiscal years 2010 and 2009, respectively. During fiscal year 2011, we constructed 146
company-owned salons and three hair restoration centers, and acquired 105 company-owned salons (78 of which were franchise buybacks) and
four hair restoration centers (all of which were franchise buybacks).
Cash used by investing activities was lower during fiscal year 2010 compared to fiscal year 2009 due to the planned reduction in
acquisitions and capital expenditures and the receipt of $15.0 million on the revolving credit facility with EEG of which there was $0.0 and
$15.0 million outstanding as of June 30, 2010 and 2009, respectively. The Company completed 333 major remodeling projects during fiscal
year 2010, compared to 280 and 186 during fiscal years 2009 and 2008, respectively. We constructed 139 company
-owned salons, four hair
restoration centers and acquired 26 company-owned salons (23 of which were franchise buybacks) and zero hair restoration centers.
65
Investing Cash Flows
For the Years Ended June 30,
2012 2011 2010
(Dollars in thousands)
Business and salon acquisitions
$
(2,587
)
$
(17,990
)
$
(3,664
)
Capital expenditures for remodels or other
additions
(36,128
)
(44,855
)
(40,561
)
Capital expenditures for the corporate
office (including all technology-related
expenditures)
(27,072
)
(13,826
)
(7,828
)
Capital expenditures for new salon
construction
(22,569
)
(12,788
)
(9,432
)
Proceeds from loans and investments
11,995
16,804
16,099
Disbursements for loans and investments
(15,000
)
(72,301
)
—
Freestanding derivative settlement
—
—
736
Proceeds from sale of assets
502
626
70
$
(90,859
)
$
(144,330
)
$
(44,580
)