Supercuts 2012 Annual Report Download - page 137
Download and view the complete annual report
Please find page 137 of the 2012 Supercuts annual report below. You can navigate through the pages in the report by either clicking on the pages listed below, or by using the keyword search tool below to find specific information within the annual report.-
 1
1 -
2
-
3
-
4
-
5
-
6
-
7
-
8
-
9
-
10
-
11
-
12
-
13
-
14
-
15
-
16
-
17
-
18
-
19
-
20
-
21
-
22
-
23
-
24
-
25
-
26
-
27
-
28
-
29
-
30
-
31
-
32
-
33
-
34
-
35
-
36
-
37
-
38
-
39
-
40
-
41
-
42
-
43
-
44
-
45
-
46
-
47
-
48
-
49
-
50
-
51
-
52
-
53
-
54
-
55
-
56
-
57
-
58
-
59
-
60
-
61
-
62
-
63
-
64
-
65
-
66
-
67
-
68
-
69
-
70
-
71
-
72
-
73
-
74
-
75
-
76
-
77
-
78
-
79
-
80
-
81
-
82
-
83
-
84
-
85
-
86
-
87
-
88
-
89
-
90
-
91
-
92
-
93
-
94
-
95
-
96
-
97
-
98
-
99
-
100
-
101
-
102
-
103
-
104
-
105
-
106
-
107
-
108
-
109
-
110
-
111
-
112
-
113
-
114
-
115
-
116
-
117
-
118
-
119
-
120
-
121
-
122
-
123
-
124
-
125
-
126
-
 127
127 -
 128
128 -
 129
129 -
 130
130 -
 131
131 -
 132
132 -
 133
133 -
 134
134 -
 135
135 -
 136
136 -
 137
137 -
 138
138 -
 139
139 -
 140
140 -
 141
141 -
 142
142 -
 143
143 -
 144
144 -
 145
145 -
 146
146 -
 147
147 -
148
-
149
-
150
-
151
-
152
-
153
-
154
-
155
-
156
-
157
-
158
-
159
-
160
-
161
-
162
-
163
-
164
-
165
-
166
-
167
-
168
-
169
-
170
-
171
-
172
-
173
-
174
-
175
-
176
-
177
-
178
-
179
-
180
-
181
 |
 |

Table of Contents
NOTES TO CONSOLIDATED FINANCIAL STATEMENTS (Continued)
14. SHAREHOLDERS' EQUITY (Continued)
modifications, the Company recognized an incremental compensation cost of $0.2 and less than $0.1 million during fiscal years 2012 and 2011,
respectively.
Total cash received from the exercise of share-based instruments in fiscal years 2012, 2011 and 2010 was less than $0.1, $0.7, and
$3.1 million, respectively.
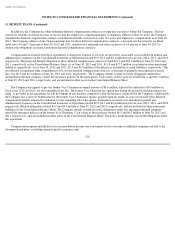
As of June 30, 2012, the total unrecognized compensation cost related to all unvested stock-based compensation arrangements was
$7.8 million. The related weighted average period over which such cost is expected to be recognized was approximately 2.6 years as of
June 30, 2012.
The total intrinsic value of all stock-based compensation that was exercised during fiscal years 2012, 2011, and 2010 was less than $0.1,
$0.2, and $0.7 million, respectively.
The total fair value of stock awards that vested and were distributed during fiscal years 2012, 2011, and 2010 was $4.8, $5.4, and
$4.9 million, respectively.
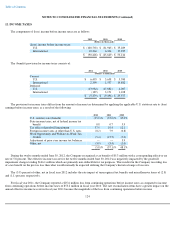
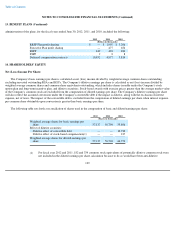
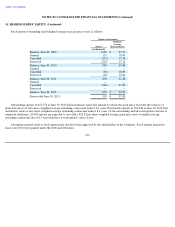
Using the fair value of each grant on the date of grant, the weighted average fair values per stock-based compensation award granted
during fiscal years 2012, 2011 and 2010 were as follows:
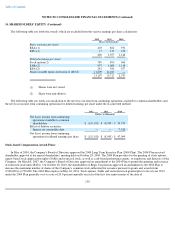
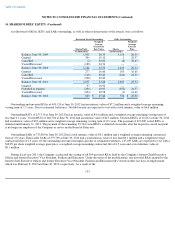
The expense associated with the RSA and RSU grants is based on the market price of the Company's stock at the date of grant. The
significant assumptions used in determining the underlying fair value on the date of grant of each stock option and SAR grant issued during the
fiscal years 2012, 2011 and 2010 is presented below:
The risk free rate of return is determined based on the U.S. Treasury rates approximating the expected life of the options and SARs
granted. Expected volatility is established based on historical volatility of the Company's stock price. Estimated expected life was based on an
analysis of historical stock options granted data which included analyzing grant activity including grants exercised, expired, and canceled. The
expected dividend yield is determined based on the Company's annual dividend amount as a percentage of the strike price at the time of the
grant. The Company uses historical data to estimate pre-vesting forfeiture rates.
Compensation expense included in income before income taxes related to stock- based compensation was $7.6, $9.6, and $9.3 million for
the three years ended June 30, 2012, 2011, and 2010, respectively.
Authorized Shares and Designation of Preferred Class:
The Company has 100 million shares of capital stock authorized, par value $0.05, of which all outstanding shares, and shares available
under the Stock Option Plans, have been designated as common.
134
2012 2011 2010
Stock options
$
—
$
—
$
7.36
SARs
—
6.26
8.60
Restricted stock awards
16.15
16.60
19.12
Restricted stock units
17.96
—
—
2012 2011 2010
Risk
-
free interest rate
N/A
2.29
%
2.79
%
Expected term (in years)
N/A
5.50
5.50
Expected volatility
N/A
44.00
%
42.00
%
Expected dividend yield
N/A
1.45
%
0.85
%