Supercuts 2012 Annual Report Download - page 64
Download and view the complete annual report
Please find page 64 of the 2012 Supercuts annual report below. You can navigate through the pages in the report by either clicking on the pages listed below, or by using the keyword search tool below to find specific information within the annual report.-
 1
1 -
2
-
3
-
4
-
5
-
6
-
7
-
8
-
9
-
10
-
11
-
12
-
13
-
14
-
15
-
16
-
17
-
18
-
19
-
20
-
21
-
22
-
23
-
24
-
25
-
26
-
27
-
28
-
29
-
30
-
31
-
32
-
33
-
34
-
35
-
36
-
37
-
38
-
39
-
40
-
41
-
42
-
43
-
44
-
45
-
46
-
47
-
48
-
49
-
50
-
51
-
52
-
53
-
 54
54 -
 55
55 -
 56
56 -
 57
57 -
 58
58 -
 59
59 -
 60
60 -
 61
61 -
 62
62 -
 63
63 -
 64
64 -
 65
65 -
 66
66 -
 67
67 -
 68
68 -
 69
69 -
 70
70 -
 71
71 -
 72
72 -
 73
73 -
 74
74 -
75
-
76
-
77
-
78
-
79
-
80
-
81
-
82
-
83
-
84
-
85
-
86
-
87
-
88
-
89
-
90
-
91
-
92
-
93
-
94
-
95
-
96
-
97
-
98
-
99
-
100
-
101
-
102
-
103
-
104
-
105
-
106
-
107
-
108
-
109
-
110
-
111
-
112
-
113
-
114
-
115
-
116
-
117
-
118
-
119
-
120
-
121
-
122
-
123
-
124
-
125
-
126
-
127
-
128
-
129
-
130
-
131
-
132
-
133
-
134
-
135
-
136
-
137
-
138
-
139
-
140
-
141
-
142
-
143
-
144
-
145
-
146
-
147
-
148
-
149
-
150
-
151
-
152
-
153
-
154
-
155
-
156
-
157
-
158
-
159
-
160
-
161
-
162
-
163
-
164
-
165
-
166
-
167
-
168
-
169
-
170
-
171
-
172
-
173
-
174
-
175
-
176
-
177
-
178
-
179
-
180
-
181
 |
 |

Table of Contents
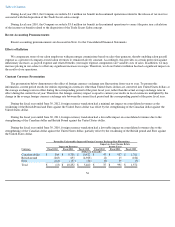
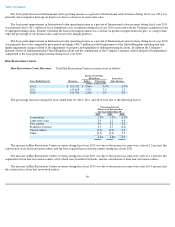
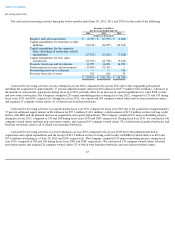
valuation reserve on the note receivable with the purchaser of Trade Secret, incremental costs associated with the Company's senior
management restructure, professional fees incurred related to the exploration of strategic alternatives and information technology projects and
legal claims expense.
The increase in unallocated corporate operating loss during the twelve months ended June 30, 2010 as compared to the twelve months
ended June 30, 2009 was primarily due to an increase in professional fees and distribution costs from an agreement with the purchaser of Trade
Secret.
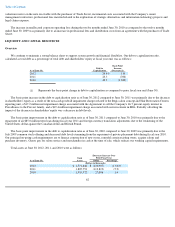
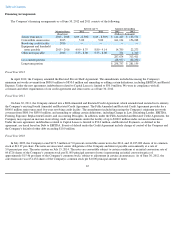
LIQUIDITY AND CAPITAL RESOURCES
Overview
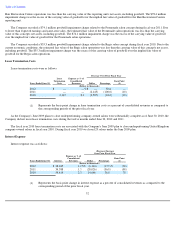
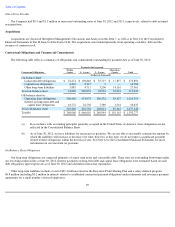
We continue to maintain a strong balance sheet to support system growth and financial flexibility. Our debt to capitalization ratio,
calculated as total debt as a percentage of total debt and shareholders' equity at fiscal year end, was as follows:
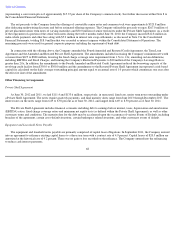
The basis point increase in the debt to capitalization ratio as of June 30, 2012 compared to June 30, 2011 was primarily due to the decrease
in shareholders' equity as a result of the non-cash goodwill impairment charges related to the Regis salon concept and Hair Restoration Centers
reporting unit, a $17.2 million net impairment charge associated with the Agreement to sell the Company's 46.7 percent equity interest in
Provalliance to the Provost family, and a $19.4 million impairment charge associated with our investment in EEG. Partially offsetting the
impact of the decrease in shareholders' equity was a decrease in debt levels.
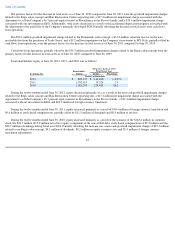
The basis point improvement in the debt to capitalization ratio as of June 30, 2011 compared to June 30, 2010 was primarily due to the
repayment of an $85.0 million term loan during fiscal year 2011 and foreign currency translation adjustments due to the weakening of the
United States dollar against the Canadian dollar and British Pound.
The basis point improvement in the debt to capitalization ratio as of June 30, 2010 compared to June 30, 2009 was primarily due to the
July 2009 common stock offering and decreased debt levels stemming from the repayment of private placement debt during fiscal year 2010.
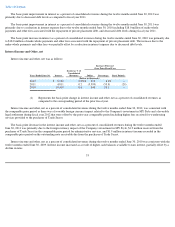
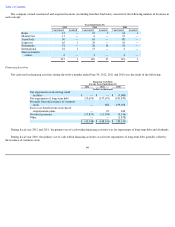
Our principal on-going cash requirements are to finance construction of new stores, remodel certain existing stores, acquire salons and
purchase inventory. Guests pay for salon services and merchandise in cash at the time of sale, which reduces our working capital requirements.
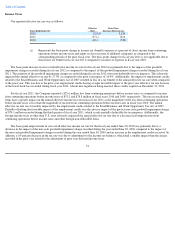
Total assets at June 30, 2012, 2011, and 2010 were as follows:
62
As of June 30, Debt to
Capitalization
Basis Point
Increase
(Decrease)(1)
2012
24.4
%
110
2011
23.3
(700
)
2010
30.3
(1,380
)
(1)
Represents the basis point change
in debt to capitalization as compared to prior fiscal year end (June 30).
(Decrease) Increase Over
Prior Fiscal Year
Total
Assets
As of June 30, Dollar Percentage
(Dollars in thousands)
2012
$
1,571,846
$
(233,907
)
(13.0
)%
2011
1,805,753
(113,819
)
(5.9
)
2010
1,919,572
27,086
1.4