Supercuts 2012 Annual Report Download - page 103
Download and view the complete annual report
Please find page 103 of the 2012 Supercuts annual report below. You can navigate through the pages in the report by either clicking on the pages listed below, or by using the keyword search tool below to find specific information within the annual report.-
 1
1 -
2
-
3
-
4
-
5
-
6
-
7
-
8
-
9
-
10
-
11
-
12
-
13
-
14
-
15
-
16
-
17
-
18
-
19
-
20
-
21
-
22
-
23
-
24
-
25
-
26
-
27
-
28
-
29
-
30
-
31
-
32
-
33
-
34
-
35
-
36
-
37
-
38
-
39
-
40
-
41
-
42
-
43
-
44
-
45
-
46
-
47
-
48
-
49
-
50
-
51
-
52
-
53
-
54
-
55
-
56
-
57
-
58
-
59
-
60
-
61
-
62
-
63
-
64
-
65
-
66
-
67
-
68
-
69
-
70
-
71
-
72
-
73
-
74
-
75
-
76
-
77
-
78
-
79
-
80
-
81
-
82
-
83
-
84
-
85
-
86
-
87
-
88
-
89
-
90
-
91
-
92
-
 93
93 -
 94
94 -
 95
95 -
 96
96 -
 97
97 -
 98
98 -
 99
99 -
 100
100 -
 101
101 -
 102
102 -
 103
103 -
 104
104 -
 105
105 -
 106
106 -
 107
107 -
 108
108 -
 109
109 -
 110
110 -
 111
111 -
 112
112 -
 113
113 -
114
-
115
-
116
-
117
-
118
-
119
-
120
-
121
-
122
-
123
-
124
-
125
-
126
-
127
-
128
-
129
-
130
-
131
-
132
-
133
-
134
-
135
-
136
-
137
-
138
-
139
-
140
-
141
-
142
-
143
-
144
-
145
-
146
-
147
-
148
-
149
-
150
-
151
-
152
-
153
-
154
-
155
-
156
-
157
-
158
-
159
-
160
-
161
-
162
-
163
-
164
-
165
-
166
-
167
-
168
-
169
-
170
-
171
-
172
-
173
-
174
-
175
-
176
-
177
-
178
-
179
-
180
-
181
 |
 |
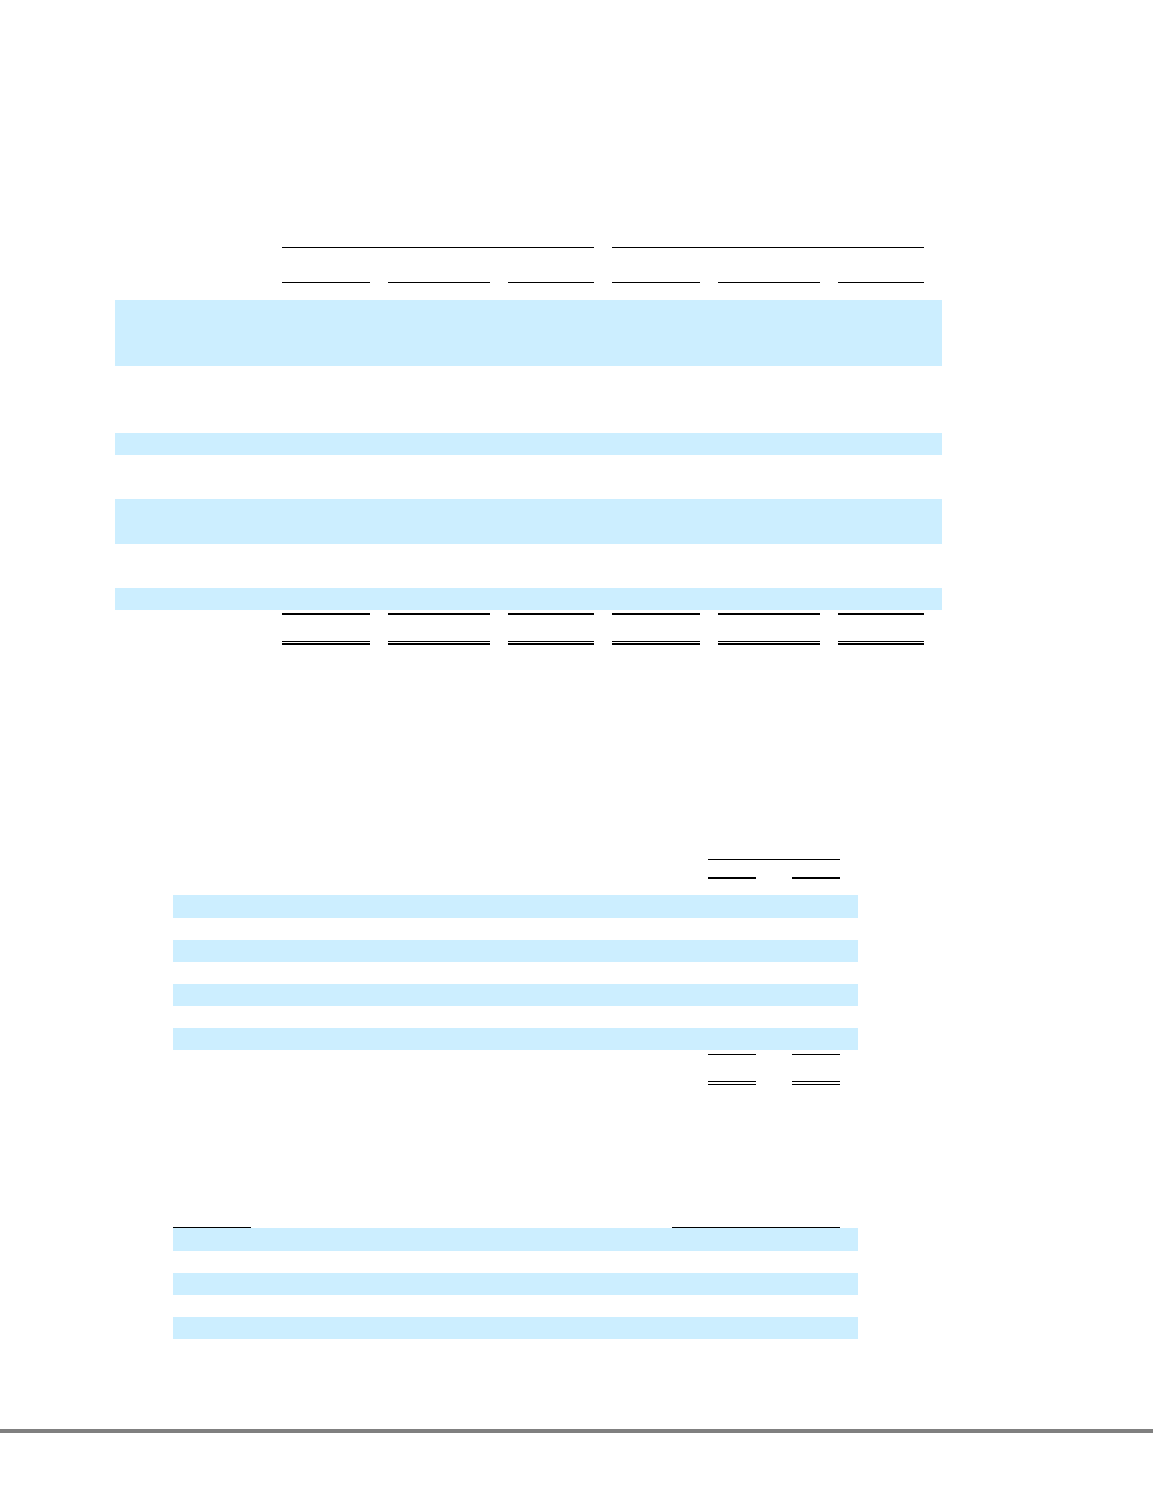
Table of Contents
NOTES TO CONSOLIDATED FINANCIAL STATEMENTS (Continued)
3. OTHER FINANCIAL STATEMENT DATA (Continued)
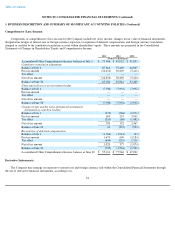
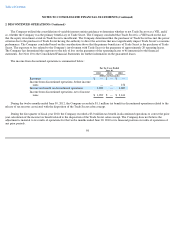
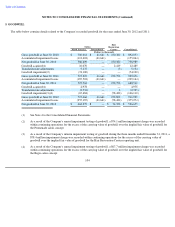
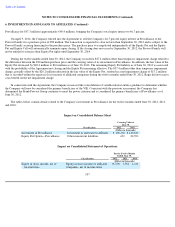
The following provides additional information concerning the other intangibles, net, balance sheet account as of June 30, 2012 and 2011:
All intangible assets have been assigned an estimated finite useful life, and are amortized on a straight-line basis over the number of years
that approximate their expected period of benefit (ranging from one to 40 years). The cost of intangible assets is amortized to earnings in
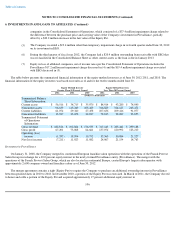
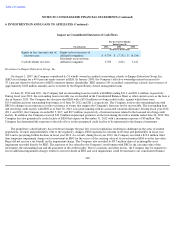
proportion to the amount of economic benefits obtained by the Company in that reporting period. The weighted average amortization periods,
in total and by major intangible asset class, are as follows:
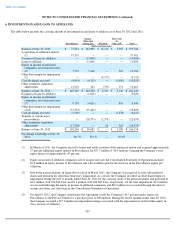
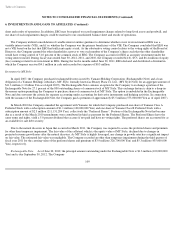
Total amortization expense related to amortizable intangible assets during the years ended June 30, 2012, 2011, and 2010 was
approximately $9.7, $9.8, and $9.9 million, respectively. As of June 30, 2012, future estimated amortization expense related to amortizable
intangible assets is estimated to be:
100
June 30, 2012 June 30, 2011
Cost Accumulated
Amortization Net Cost Accumulated
Amortization Net
(Dollars in thousands)
Amortized
intangible
assets:
Brand assets
and trade
names
$
79,995
$
(16,325
)
$
63,670
$
80,310
$
(14,329
)
$
65,981
Guest lists
53,189
(39,676
)
13,513
53,188
(34,096
)
19,092
Franchise
agreements
22,335
(9,768
)
12,567
22,221
(8,909
)
13,312
Lease
intangibles
14,896
(5,885
)
9,011
14,948
(5,168
)
9,780
Non-compete
agreements
207
(117
)
90
353
(232
)
121
Other
4,539
(1,600
)
2,939
4,429
(1,387
)
3,042
$
175,161
$
(73,371
)
$
101,790
$
175,449
$
(64,121
)
$
111,328
Weighted
Average
Amortization
Period June 30,
2012 2011
(In years)
Amortized intangible assets:
Brand assets and trade names
39
39
Guest lists
10
10
Franchise agreements
22
22
Lease intangibles
20
20
Non
-
compete agreements
6
5
Other
21
25
Total
26
26
Fiscal Year (Dollars in thousands)
2013
$
9,413
2014
9,199
2015
6,157
2016
3,999
2017
3,996