Supercuts 2012 Annual Report Download - page 104
Download and view the complete annual report
Please find page 104 of the 2012 Supercuts annual report below. You can navigate through the pages in the report by either clicking on the pages listed below, or by using the keyword search tool below to find specific information within the annual report.-
 1
1 -
2
-
3
-
4
-
5
-
6
-
7
-
8
-
9
-
10
-
11
-
12
-
13
-
14
-
15
-
16
-
17
-
18
-
19
-
20
-
21
-
22
-
23
-
24
-
25
-
26
-
27
-
28
-
29
-
30
-
31
-
32
-
33
-
34
-
35
-
36
-
37
-
38
-
39
-
40
-
41
-
42
-
43
-
44
-
45
-
46
-
47
-
48
-
49
-
50
-
51
-
52
-
53
-
54
-
55
-
56
-
57
-
58
-
59
-
60
-
61
-
62
-
63
-
64
-
65
-
66
-
67
-
68
-
69
-
70
-
71
-
72
-
73
-
74
-
75
-
76
-
77
-
78
-
79
-
80
-
81
-
82
-
83
-
84
-
85
-
86
-
87
-
88
-
89
-
90
-
91
-
92
-
93
-
 94
94 -
 95
95 -
 96
96 -
 97
97 -
 98
98 -
 99
99 -
 100
100 -
 101
101 -
 102
102 -
 103
103 -
 104
104 -
 105
105 -
 106
106 -
 107
107 -
 108
108 -
 109
109 -
 110
110 -
 111
111 -
 112
112 -
 113
113 -
 114
114 -
115
-
116
-
117
-
118
-
119
-
120
-
121
-
122
-
123
-
124
-
125
-
126
-
127
-
128
-
129
-
130
-
131
-
132
-
133
-
134
-
135
-
136
-
137
-
138
-
139
-
140
-
141
-
142
-
143
-
144
-
145
-
146
-
147
-
148
-
149
-
150
-
151
-
152
-
153
-
154
-
155
-
156
-
157
-
158
-
159
-
160
-
161
-
162
-
163
-
164
-
165
-
166
-
167
-
168
-
169
-
170
-
171
-
172
-
173
-
174
-
175
-
176
-
177
-
178
-
179
-
180
-
181
 |
 |

Table of Contents
NOTES TO CONSOLIDATED FINANCIAL STATEMENTS (Continued)
3. OTHER FINANCIAL STATEMENT DATA (Continued)
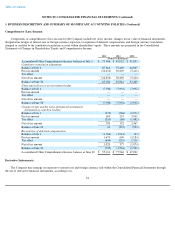
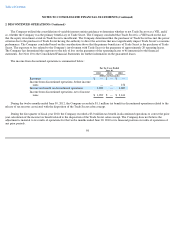
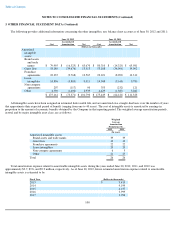
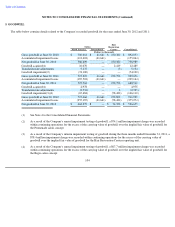
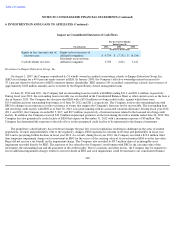
The following provides supplemental disclosures of cash flow activity:
Significant non-cash investing and financing activities include the following:
The Company did not finance capital expenditures through capital leases during fiscal year 2012. In fiscal years 2011 and 2010, the
Company financed capital expenditures totaling $6.0, and $7.9 million, respectively, through capital leases.
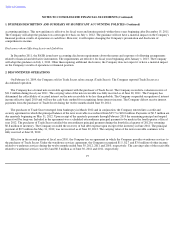
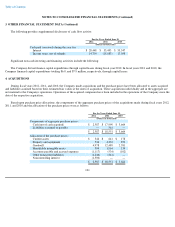
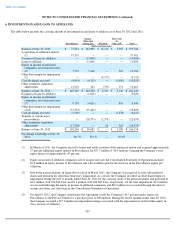
4. ACQUISITIONS
During fiscal years 2012, 2011, and 2010, the Company made acquisitions and the purchase prices have been allocated to assets acquired
and liabilities assumed based on their estimated fair values at the dates of acquisition. These acquisitions individually and in the aggregate are
not material to the Company's operations. Operations of the acquired companies have been included in the operations of the Company since the
date of the respective acquisition.
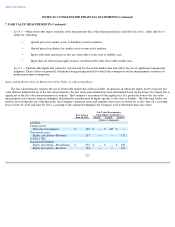
Based upon purchase price allocations, the components of the aggregate purchase prices of the acquisitions made during fiscal years 2012,
2011, and 2010 and the allocation of the purchase prices were as follows:
101
For the Years Ended June 30,
2012 2011 2010
(Dollars in thousands)
Cash paid (received) during the year for:
Interest
$
28,448
$
33,493
$
53,547
Income taxes, net of refunds
14,754
(15,083
)
17,058
For the Years Ended June 30,
2012 2011 2010
(Dollars in thousands)
Components of aggregate purchase prices:
Cash (net of cash acquired)
$
2,587
$
17,990
$
3,664
Liabilities assumed or payable
—
561
—
$
2,587
$
18,551
$
3,664
Allocation of the purchase prices:
Current assets
$
344
$
641
$
178
Property and equipment
534
4,232
873
Goodwill
4,978
12,489
2,581
Identifiable intangible assets
594
1,964
134
Accounts payable and accrued expenses
(1,117
)
(534
)
(102
)
Other noncurrent liabilities
(1,246
)
(241
)
—
Noncontrolling interest
(1,500
)
—
—
$
2,587
$
18,551
$
3,664