Supercuts 2012 Annual Report Download - page 51
Download and view the complete annual report
Please find page 51 of the 2012 Supercuts annual report below. You can navigate through the pages in the report by either clicking on the pages listed below, or by using the keyword search tool below to find specific information within the annual report.-
 1
1 -
2
-
3
-
4
-
5
-
6
-
7
-
8
-
9
-
10
-
11
-
12
-
13
-
14
-
15
-
16
-
17
-
18
-
19
-
20
-
21
-
22
-
23
-
24
-
25
-
26
-
27
-
28
-
29
-
30
-
31
-
32
-
33
-
34
-
35
-
36
-
37
-
38
-
39
-
40
-
 41
41 -
 42
42 -
 43
43 -
 44
44 -
 45
45 -
 46
46 -
 47
47 -
 48
48 -
 49
49 -
 50
50 -
 51
51 -
 52
52 -
 53
53 -
 54
54 -
 55
55 -
 56
56 -
 57
57 -
 58
58 -
 59
59 -
 60
60 -
 61
61 -
62
-
63
-
64
-
65
-
66
-
67
-
68
-
69
-
70
-
71
-
72
-
73
-
74
-
75
-
76
-
77
-
78
-
79
-
80
-
81
-
82
-
83
-
84
-
85
-
86
-
87
-
88
-
89
-
90
-
91
-
92
-
93
-
94
-
95
-
96
-
97
-
98
-
99
-
100
-
101
-
102
-
103
-
104
-
105
-
106
-
107
-
108
-
109
-
110
-
111
-
112
-
113
-
114
-
115
-
116
-
117
-
118
-
119
-
120
-
121
-
122
-
123
-
124
-
125
-
126
-
127
-
128
-
129
-
130
-
131
-
132
-
133
-
134
-
135
-
136
-
137
-
138
-
139
-
140
-
141
-
142
-
143
-
144
-
145
-
146
-
147
-
148
-
149
-
150
-
151
-
152
-
153
-
154
-
155
-
156
-
157
-
158
-
159
-
160
-
161
-
162
-
163
-
164
-
165
-
166
-
167
-
168
-
169
-
170
-
171
-
172
-
173
-
174
-
175
-
176
-
177
-
178
-
179
-
180
-
181
 |
 |

Table of Contents
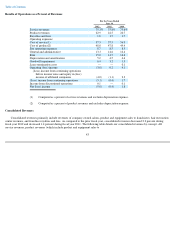
The basis point improvement in product margin other than sold to purchaser of Trade Secret as a percentage of product revenues during
fiscal year 2010 was due to a planned reduction in retail commissions paid to new employees on retail product sales.
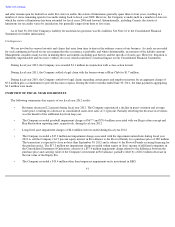
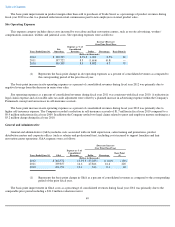
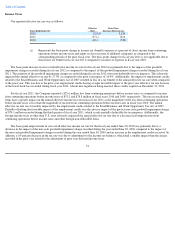
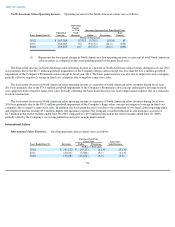
Site Operating Expenses
This expense category includes direct costs incurred by our salons and hair restoration centers, such as on-site advertising, workers'
compensation, insurance, utilities and janitorial costs. Site operating expenses were as follows:
The basis point increase in site operating expenses as a percent of consolidated revenues during fiscal year 2012 was primarily due to
negative leverage from the decrease in same-store sales.
Site operating expenses as a percent of consolidated revenues during fiscal year 2011 was consistent with fiscal year 2010. A reduction in
legal claims expense and a favorable sales tax audit adjustment were offset by a planned increase in advertising expense within the Company's
Promenade concept and an increase in self-insurance accruals.
The basis point increase in site operating expenses as a percent of consolidated revenues during fiscal year 2010 was primarily due to
higher self-insurance expense. The Company recorded a reduction in self-insurance accruals of $1.7 million in fiscal year 2010 compared to a
$9.9 million reduction in fiscal year 2009. In addition the Company settled two legal claims related to guest and employee matters resulting in a
$5.2 million charge during fiscal year 2010.
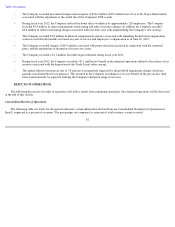
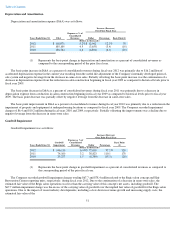
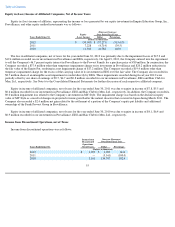
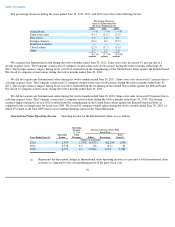
General and Administrative
General and administrative (G&A) includes costs associated with our field supervision, salon training and promotions, product
distribution centers and corporate offices (such as salaries and professional fees), including costs incurred to support franchise and hair
restoration center operations. G&A expenses were as follows:
The basis point improvement in G&A costs as a percentage of consolidated revenues during fiscal year 2012 was primarily due to the
comparable prior period including a $31.2 million valuation reserve
49
Increase (Decrease)
Over Prior Fiscal Year
Years Ended June 30, Site
Operating
Expense as % of
Consolidated
Revenues Dollar Percentage
Basis Point(1)
(Dollars in thousands)
2012
$
198,725
8.7
%
$
1,003
0.5
%
20
2011
197,722
8.5
(1,616
)
(0.8
)
—
2010
199,338
8.5
8,882
4.7
70
(1) Represents the basis point change in site operating expenses as a percent of consolidated revenues as compared to
the corresponding period of the prior fiscal year.
(Decrease) Increase
Over Prior Fiscal Year
Years Ended June 30, G&A
Expense as % of
Consolidated
Revenues Dollar Percentage Basis Point
(1)
(Dollars in thousands)
2012
$
302,572
13.3
%
$
(37,285
)
(11.0
)%
(130
)
2011
339,857
14.6
47,866
16.4
220
2010
291,991
12.4
330
0.1
40
(1)
Represents the basis point change in G&A as a percent of consolidated revenues as compared to the corresponding
period of the prior fiscal year.