Supercuts 2012 Annual Report Download - page 142
Download and view the complete annual report
Please find page 142 of the 2012 Supercuts annual report below. You can navigate through the pages in the report by either clicking on the pages listed below, or by using the keyword search tool below to find specific information within the annual report.-
 1
1 -
2
-
3
-
4
-
5
-
6
-
7
-
8
-
9
-
10
-
11
-
12
-
13
-
14
-
15
-
16
-
17
-
18
-
19
-
20
-
21
-
22
-
23
-
24
-
25
-
26
-
27
-
28
-
29
-
30
-
31
-
32
-
33
-
34
-
35
-
36
-
37
-
38
-
39
-
40
-
41
-
42
-
43
-
44
-
45
-
46
-
47
-
48
-
49
-
50
-
51
-
52
-
53
-
54
-
55
-
56
-
57
-
58
-
59
-
60
-
61
-
62
-
63
-
64
-
65
-
66
-
67
-
68
-
69
-
70
-
71
-
72
-
73
-
74
-
75
-
76
-
77
-
78
-
79
-
80
-
81
-
82
-
83
-
84
-
85
-
86
-
87
-
88
-
89
-
90
-
91
-
92
-
93
-
94
-
95
-
96
-
97
-
98
-
99
-
100
-
101
-
102
-
103
-
104
-
105
-
106
-
107
-
108
-
109
-
110
-
111
-
112
-
113
-
114
-
115
-
116
-
117
-
118
-
119
-
120
-
121
-
122
-
123
-
124
-
125
-
126
-
127
-
128
-
129
-
130
-
131
-
 132
132 -
 133
133 -
 134
134 -
 135
135 -
 136
136 -
 137
137 -
 138
138 -
 139
139 -
 140
140 -
 141
141 -
 142
142 -
 143
143 -
 144
144 -
 145
145 -
 146
146 -
 147
147 -
 148
148 -
 149
149 -
 150
150 -
 151
151 -
 152
152 -
153
-
154
-
155
-
156
-
157
-
158
-
159
-
160
-
161
-
162
-
163
-
164
-
165
-
166
-
167
-
168
-
169
-
170
-
171
-
172
-
173
-
174
-
175
-
176
-
177
-
178
-
179
-
180
-
181
 |
 |

Table of Contents
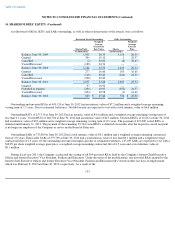
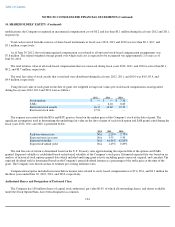
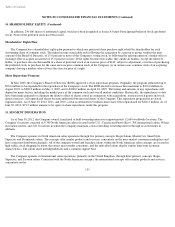
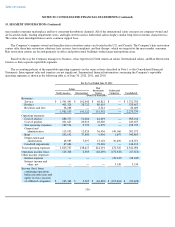
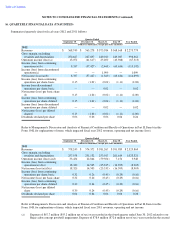
NOTES TO CONSOLIDATED FINANCIAL STATEMENTS (Continued)
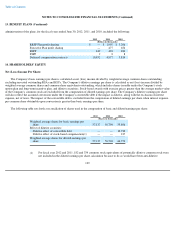
16. QUARTERLY FINANCIAL DATA (UNAUDITED)
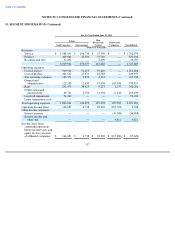
Summarized quarterly data for fiscal years 2012 and 2011 follows:
Quarter Ended
September 30 December 31 March 31 June 30 Year Ended
(Dollars in thousands, except per share amounts)
2012
Revenues
$
568,749
$
563,278
$
573,584
$
568,168
$
2,273,779
Gross margin, excluding
royalties and depreciation
252,627
247,697
249,010
249,027
998,361
Operating income (loss)(a)
13,072
(61,617
)
25,200
(43,968
)
(67,313
)
Income (loss) from continuing
operations(a)(b)
8,337
(57,427
)
(2,468
)
(63,634
)
(115,192
)
Income (loss) from discontinued
operations(c)
—
—
1,099
—
1,099
Net income (loss)(a)(b)
8,337
(57,427
)
(1,369
)
(63,634
)
(114,093
)
Income (loss) from continuing
operations per share, basic
0.15
(1.01
)
(0.04
)
(1.11
)
(2.02
)
Income from discontinued
operations per share, basic
—
—
0.02
—
0.02
Net income (loss) per basic share
(f)
0.15
(1.01
)
(0.02
)
(1.11
)
(2.00
)
Income (loss) from continuing
operations per share, diluted
0.15
(1.01
)
(0.04
)
(1.11
)
(2.02
)
Income (loss) from discontinued
operations per share, diluted
—
—
0.02
—
0.02
Net income (loss) per diluted
share(f)
0.15
(1.01
)
(0.02
)
(1.11
)
(2.00
)
Dividends declared per share
0.06
0.06
0.06
0.06
0.24
Refer to Management's Discussion and Analysis of Financial Condition and Results of Operations in Part II, Item 6 in this
Form 10
-
K for explanations of items, which impacted fiscal year 2012 revenues, operating and net income (loss).
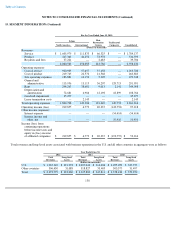
Quarter Ended
September 30 December 31 March 31 June 30 Year Ended
(Dollars in thousands, except per share amounts)
2011
Revenues
$
578,245
$
574,372
$
581,267
$
591,985
$
2,325,869
Gross margin, excluding
royalties and depreciation
257,558
251,132
253,017
261,614
1,023,321
Operating income (loss)(a)(d)
33,434
22,864
(59,504
)
7,154
3,948
Income (loss) from continuing
operations(a)(d)(e)
18,320
14,505
(25,335
)
(16,395
)
(8,905
)
Net income (loss)(a)(d)(e)
18,320
14,505
(25,335
)
(16,395
)
(8,905
)
Income (loss) from continuing
operations per share, basic
0.32
0.26
(0.45
)
(0.29
)
(0.16
)
Net income (loss) per basic share
0.32
0.26
(0.45
)
(0.29
)
(0.16
)
Income (loss) from continuing
operations per share, diluted
0.30
0.24
(0.45
)
(0.29
)
(0.16
)
Net income (loss) per diluted
share
0.30
0.24
(0.45
)
(0.29
)
(0.16
)
Dividends declared per share
0.04
0.04
0.06
0.06
0.20
Refer to Management's Discussion and Analysis of Financial Condition and Results of Operations in Part II, Item 6 in this
Form 10-K for explanations of items, which impacted fiscal year 2011 revenues, operating and net income.
(a) Expense of $67.7 million ($55.2 million net of tax) was recorded in the fourth quarter ended June 30, 2012 related to our
Regis salon concept goodwill impairment. Expense of $78.4 million ($72.6 million net of tax) was recorded in the second