Supercuts 2012 Annual Report Download - page 114
Download and view the complete annual report
Please find page 114 of the 2012 Supercuts annual report below. You can navigate through the pages in the report by either clicking on the pages listed below, or by using the keyword search tool below to find specific information within the annual report.-
 1
1 -
2
-
3
-
4
-
5
-
6
-
7
-
8
-
9
-
10
-
11
-
12
-
13
-
14
-
15
-
16
-
17
-
18
-
19
-
20
-
21
-
22
-
23
-
24
-
25
-
26
-
27
-
28
-
29
-
30
-
31
-
32
-
33
-
34
-
35
-
36
-
37
-
38
-
39
-
40
-
41
-
42
-
43
-
44
-
45
-
46
-
47
-
48
-
49
-
50
-
51
-
52
-
53
-
54
-
55
-
56
-
57
-
58
-
59
-
60
-
61
-
62
-
63
-
64
-
65
-
66
-
67
-
68
-
69
-
70
-
71
-
72
-
73
-
74
-
75
-
76
-
77
-
78
-
79
-
80
-
81
-
82
-
83
-
84
-
85
-
86
-
87
-
88
-
89
-
90
-
91
-
92
-
93
-
94
-
95
-
96
-
97
-
98
-
99
-
100
-
101
-
102
-
103
-
 104
104 -
 105
105 -
 106
106 -
 107
107 -
 108
108 -
 109
109 -
 110
110 -
 111
111 -
 112
112 -
 113
113 -
 114
114 -
 115
115 -
 116
116 -
 117
117 -
 118
118 -
 119
119 -
 120
120 -
 121
121 -
 122
122 -
 123
123 -
 124
124 -
125
-
126
-
127
-
128
-
129
-
130
-
131
-
132
-
133
-
134
-
135
-
136
-
137
-
138
-
139
-
140
-
141
-
142
-
143
-
144
-
145
-
146
-
147
-
148
-
149
-
150
-
151
-
152
-
153
-
154
-
155
-
156
-
157
-
158
-
159
-
160
-
161
-
162
-
163
-
164
-
165
-
166
-
167
-
168
-
169
-
170
-
171
-
172
-
173
-
174
-
175
-
176
-
177
-
178
-
179
-
180
-
181
 |
 |

Table of Contents
NOTES TO CONSOLIDATED FINANCIAL STATEMENTS (Continued)
7. FAIR VALUE MEASUREMENTS (Continued)
Level 2 —Other observable inputs available at the measurement date, other than quoted prices included in Level 1, either directly or
indirectly, including:
• Quoted prices for similar assets or liabilities in active markets;
• Quoted prices for identical or similar assets in non-active markets;
• Inputs other than quoted prices that are observable for the asset or liability; and
• Inputs that are derived principally from or corroborated by other observable market data.
Level 3 —Unobservable inputs that cannot be corroborated by observable market data and reflect the use of significant management
judgment. These values are generally determined using pricing models for which the assumptions utilize management's estimates of
market participant assumptions.
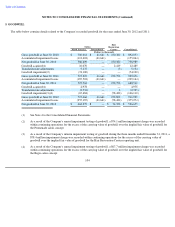
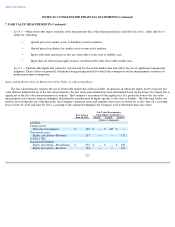
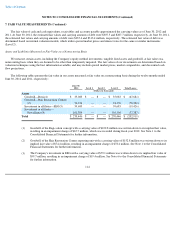
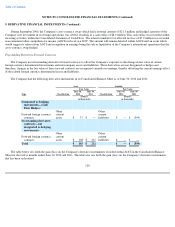
Assets and Liabilities that are Measured at Fair Value on a Recurring Basis
The fair value hierarchy requires the use of observable market data when available. In instances in which the inputs used to measure fair
value fall into different levels of the fair value hierarchy, the fair value measurement has been determined based on the lowest level input that is
significant to the fair value measurement in its entirety. The Company's assessment of the significance of a particular item to the fair value
measurement in its entirety requires judgment, including the consideration of inputs specific to the asset or liability. The following tables sets
forth by level within the fair value hierarchy, the Company's financial assets and liabilities that were accounted for at fair value on a recurring
basis at June 30, 2012 and June 30, 2011, according to the valuation techniques the Company used to determine their fair values.
111
Fair Value Measurements
Using Inputs Considered as
Fair Value at
June 30, 2012
Level 1 Level 2 Level 3
(Dollars in thousands)
ASSETS
Current assets
Derivative instruments
$
145
$
—
$
145
$
—
Noncurrent assets
Equity call option
—
Roosters
117
—
—
117
LIABILITIES
Noncurrent liabilities
Equity put option
—
Provalliance
$
633
$
—
$
—
$
633
Equity put option
—
Roosters
161
—
—
161