Supercuts 2012 Annual Report Download - page 139
Download and view the complete annual report
Please find page 139 of the 2012 Supercuts annual report below. You can navigate through the pages in the report by either clicking on the pages listed below, or by using the keyword search tool below to find specific information within the annual report.-
 1
1 -
2
-
3
-
4
-
5
-
6
-
7
-
8
-
9
-
10
-
11
-
12
-
13
-
14
-
15
-
16
-
17
-
18
-
19
-
20
-
21
-
22
-
23
-
24
-
25
-
26
-
27
-
28
-
29
-
30
-
31
-
32
-
33
-
34
-
35
-
36
-
37
-
38
-
39
-
40
-
41
-
42
-
43
-
44
-
45
-
46
-
47
-
48
-
49
-
50
-
51
-
52
-
53
-
54
-
55
-
56
-
57
-
58
-
59
-
60
-
61
-
62
-
63
-
64
-
65
-
66
-
67
-
68
-
69
-
70
-
71
-
72
-
73
-
74
-
75
-
76
-
77
-
78
-
79
-
80
-
81
-
82
-
83
-
84
-
85
-
86
-
87
-
88
-
89
-
90
-
91
-
92
-
93
-
94
-
95
-
96
-
97
-
98
-
99
-
100
-
101
-
102
-
103
-
104
-
105
-
106
-
107
-
108
-
109
-
110
-
111
-
112
-
113
-
114
-
115
-
116
-
117
-
118
-
119
-
120
-
121
-
122
-
123
-
124
-
125
-
126
-
127
-
128
-
 129
129 -
 130
130 -
 131
131 -
 132
132 -
 133
133 -
 134
134 -
 135
135 -
 136
136 -
 137
137 -
 138
138 -
 139
139 -
 140
140 -
 141
141 -
 142
142 -
 143
143 -
 144
144 -
 145
145 -
 146
146 -
 147
147 -
 148
148 -
 149
149 -
150
-
151
-
152
-
153
-
154
-
155
-
156
-
157
-
158
-
159
-
160
-
161
-
162
-
163
-
164
-
165
-
166
-
167
-
168
-
169
-
170
-
171
-
172
-
173
-
174
-
175
-
176
-
177
-
178
-
179
-
180
-
181
 |
 |

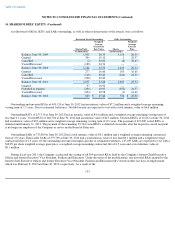
Table of Contents
NOTES TO CONSOLIDATED FINANCIAL STATEMENTS (Continued)
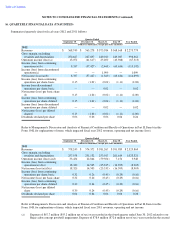
15. SEGMENT INFORMATION (Continued)
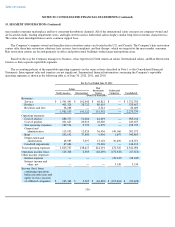
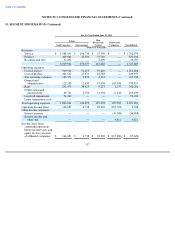
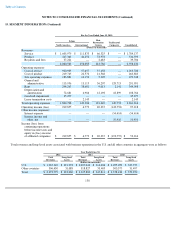
mass market consumer marketplace and have consistent distribution channels. All of the international salon concepts are company-owned and
are located in malls, leading department stores, and high-street locations. Individual salons display similar long-term economic characteristics.
The salons share interdependencies and a common support base.
The Company's company-
owned and franchise hair restoration centers are located in the U.S. and Canada. The Company's hair restoration
centers offer three hair restoration solutions; hair systems, hair transplants, and hair therapy, which are targeted at the mass market consumer.
Hair restoration centers are located primarily in office and professional buildings within larger metropolitan areas.
Based on the way the Company manages its business, it has reported its North American salons, International salons, and Hair Restoration
Centers as three separate reportable segments.
The accounting policies of the reportable operating segments are the same as those described in Note 1 to the Consolidated Financial
Statements. Intersegment sales and transfers are not significant. Summarized financial information concerning the Company's reportable
operating segments is shown in the following table as of June 30, 2012, 2011, and 2010:
136
For the Year Ended June 30, 2012
Salons
Hair
Restoration
Centers Unallocated
Corporate
North America International Consolidated
(Dollars in thousands)
Revenues:
Service
$
1,541,491
$
102,400
$
68,812
$
—
$
1,712,703
Product
401,326
38,722
80,419
—
520,467
Royalties and fees
38,288
—
2,321
—
40,609
1,981,105
141,122
151,552
—
2,273,779
Operating expenses:
Cost of service
888,777
53,684
42,693
—
985,154
Cost of product
201,625
20,010
28,020
—
249,655
Site operating expenses
182,524
9,722
6,479
—
198,725
General and
administrative
113,952
12,024
36,436
140,160
302,572
Rent
292,192
37,880
9,036
1,697
340,805
Depreciation and
amortization
68,983
5,297
13,101
30,690
118,071
Goodwill impairment
67,684
—
78,426
—
146,110
Total operating expenses
1,815,737
138,617
214,191
172,547
2,341,092
Operating income (loss)
165,368
2,505
(62,639
)
(172,547
)
(67,313
)
Other income (expense):
Interest expense
—
—
—
(
28,245
)
(28,245
)
Interest income and
other, net
—
—
—
5,130
5,130
Income (loss) from
continuing operations
before income taxes and
equity in (loss) income
of affiliated companies
$
165,368
$
2,505
$
(62,639
)
$
(195,662
)
$
(90,428
)