Supercuts 2012 Annual Report Download - page 132
Download and view the complete annual report
Please find page 132 of the 2012 Supercuts annual report below. You can navigate through the pages in the report by either clicking on the pages listed below, or by using the keyword search tool below to find specific information within the annual report.-
 1
1 -
2
-
3
-
4
-
5
-
6
-
7
-
8
-
9
-
10
-
11
-
12
-
13
-
14
-
15
-
16
-
17
-
18
-
19
-
20
-
21
-
22
-
23
-
24
-
25
-
26
-
27
-
28
-
29
-
30
-
31
-
32
-
33
-
34
-
35
-
36
-
37
-
38
-
39
-
40
-
41
-
42
-
43
-
44
-
45
-
46
-
47
-
48
-
49
-
50
-
51
-
52
-
53
-
54
-
55
-
56
-
57
-
58
-
59
-
60
-
61
-
62
-
63
-
64
-
65
-
66
-
67
-
68
-
69
-
70
-
71
-
72
-
73
-
74
-
75
-
76
-
77
-
78
-
79
-
80
-
81
-
82
-
83
-
84
-
85
-
86
-
87
-
88
-
89
-
90
-
91
-
92
-
93
-
94
-
95
-
96
-
97
-
98
-
99
-
100
-
101
-
102
-
103
-
104
-
105
-
106
-
107
-
108
-
109
-
110
-
111
-
112
-
113
-
114
-
115
-
116
-
117
-
118
-
119
-
120
-
121
-
 122
122 -
 123
123 -
 124
124 -
 125
125 -
 126
126 -
 127
127 -
 128
128 -
 129
129 -
 130
130 -
 131
131 -
 132
132 -
 133
133 -
 134
134 -
 135
135 -
 136
136 -
 137
137 -
 138
138 -
 139
139 -
 140
140 -
 141
141 -
 142
142 -
143
-
144
-
145
-
146
-
147
-
148
-
149
-
150
-
151
-
152
-
153
-
154
-
155
-
156
-
157
-
158
-
159
-
160
-
161
-
162
-
163
-
164
-
165
-
166
-
167
-
168
-
169
-
170
-
171
-
172
-
173
-
174
-
175
-
176
-
177
-
178
-
179
-
180
-
181
 |
 |

Table of Contents
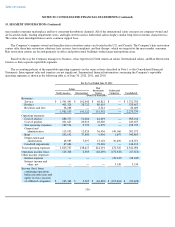
NOTES TO CONSOLIDATED FINANCIAL STATEMENTS (Continued)
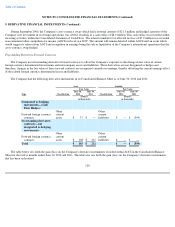
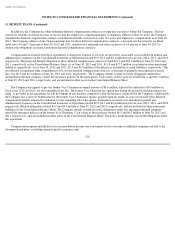
13. BENEFIT PLANS (Continued)
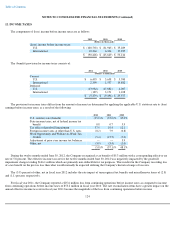
administration of the plans, for the fiscal years ended June 30, 2012, 2011, and 2010, included the following:
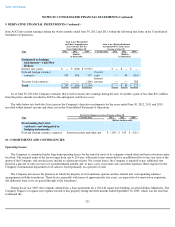
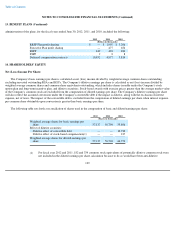
14. SHAREHOLDERS' EQUITY
Net (Loss) Income Per Share:
The Company's basic earnings per share is calculated as net (loss) income divided by weighted average common shares outstanding,
excluding unvested outstanding RSAs and RSUs. The Company's dilutive earnings per share is calculated as net (loss) income divided by
weighted average common shares and common share equivalents outstanding, which includes shares issuable under the Company's stock
option plan and long-term incentive plan, and dilutive securities. Stock-
based awards with exercise prices greater than the average market value
of the Company's common stock are excluded from the computation of diluted earnings per share. The Company's dilutive earnings per share
will also reflect the assumed conversion under the Company's convertible debt if the impact is dilutive, along with the exclusion of interest
expense, net of taxes. The impact of the convertible debt is excluded from the computation of diluted earnings per share when interest expense
per common share obtainable upon conversion is greater than basic earnings per share.
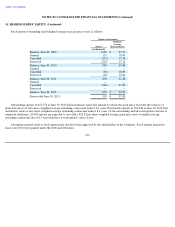
The following table sets forth a reconciliation of shares used in the computation of basic and diluted earnings per share:
129
2012 2011 2010
(Dollars in thousands)
RRSP Plan profit sharing
$
—
$
1,907
$
3,206
Executive Plan profit sharing
—
477
654
ESPP
449
494
484
FSPP
9
8
8
Deferred compensation contracts
10,452
4,977
5,814
2012 2011 2010
(Shares in thousands)
Weighted average shares for basic earnings per
share
57,137
56,704
55,806
Effect of dilutive securities:
Dilutive effect of convertible debt
—
—
10,730
Dilutive effect of stock
-
based compensation(1)
—
—
217
Weighted average shares for diluted earnings per
share
57,137
56,704
66,753
(1) For fiscal year 2012 and 2011, 182 and 334 common stock equivalents of potentially dilutive common stock were
not included in the diluted earnings per share calculation because to do so would have been anti
-
dilutive.