Supercuts 2012 Annual Report Download - page 46
Download and view the complete annual report
Please find page 46 of the 2012 Supercuts annual report below. You can navigate through the pages in the report by either clicking on the pages listed below, or by using the keyword search tool below to find specific information within the annual report.-
 1
1 -
2
-
3
-
4
-
5
-
6
-
7
-
8
-
9
-
10
-
11
-
12
-
13
-
14
-
15
-
16
-
17
-
18
-
19
-
20
-
21
-
22
-
23
-
24
-
25
-
26
-
27
-
28
-
29
-
30
-
31
-
32
-
33
-
34
-
35
-
 36
36 -
 37
37 -
 38
38 -
 39
39 -
 40
40 -
 41
41 -
 42
42 -
 43
43 -
 44
44 -
 45
45 -
 46
46 -
 47
47 -
 48
48 -
 49
49 -
 50
50 -
 51
51 -
 52
52 -
 53
53 -
 54
54 -
 55
55 -
 56
56 -
57
-
58
-
59
-
60
-
61
-
62
-
63
-
64
-
65
-
66
-
67
-
68
-
69
-
70
-
71
-
72
-
73
-
74
-
75
-
76
-
77
-
78
-
79
-
80
-
81
-
82
-
83
-
84
-
85
-
86
-
87
-
88
-
89
-
90
-
91
-
92
-
93
-
94
-
95
-
96
-
97
-
98
-
99
-
100
-
101
-
102
-
103
-
104
-
105
-
106
-
107
-
108
-
109
-
110
-
111
-
112
-
113
-
114
-
115
-
116
-
117
-
118
-
119
-
120
-
121
-
122
-
123
-
124
-
125
-
126
-
127
-
128
-
129
-
130
-
131
-
132
-
133
-
134
-
135
-
136
-
137
-
138
-
139
-
140
-
141
-
142
-
143
-
144
-
145
-
146
-
147
-
148
-
149
-
150
-
151
-
152
-
153
-
154
-
155
-
156
-
157
-
158
-
159
-
160
-
161
-
162
-
163
-
164
-
165
-
166
-
167
-
168
-
169
-
170
-
171
-
172
-
173
-
174
-
175
-
176
-
177
-
178
-
179
-
180
-
181
 |
 |

Table of Contents
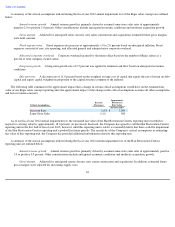
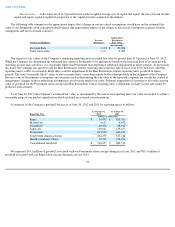
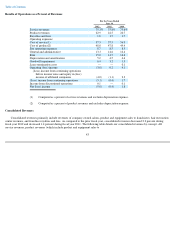
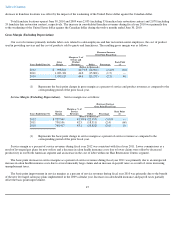
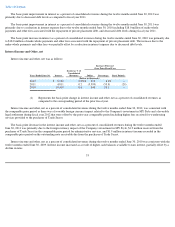
franchisees), and franchise royalties and fees are included within their respective concept within the table.
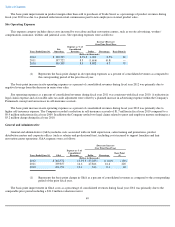
The decreases of 2.2, 1.4, and 2.9 percent in consolidated revenues during fiscal years 2012, 2011, and 2010, respectively, were driven by
the following:
44
For the Years Ended June 30,
2012 2011 2010
(Dollars in thousands)
North American salons:
Regis
$
414,752
$
434,249
$
437,990
MasterCuts
159,627
165,729
166,821
SmartStyle
514,050
531,090
533,094
Supercuts
343,764
321,881
314,698
Promenade(2)
548,912
576,995
607,960
Total North American Salons
1,981,105
2,029,944
2,060,563
International salons
141,122
150,237
156,085
Hair restoration centers
151,552
145,688
141,786
Consolidated revenues
$
2,273,779
$
2,325,869
$
2,358,434
Percent change from prior
year
(2.2
)%
(1.4
)%
(2.9
)%
Salon same-store sales
decrease(1)
(3.1
)%
(1.7
)%
(3.2
)%
(1) Same-store sales are calculated on a daily basis as the total change in sales for company-owned locations which
were open on a specific day of the week during the current period and the corresponding prior period. Quarterly
and year-to-date same-store sales are the sum of the same-store sales computed on a daily basis. Locations
relocated within a one mile radius are included in same-store sales as they are considered to have been open in the
prior period. International same-store sales are calculated in local currencies to remove foreign currency
fluctuations from the calculation.
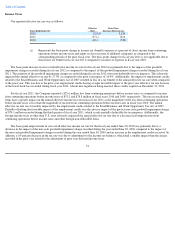
(2) Trade Secret, Inc. was sold by Regis Corporation on February 16, 2009. The agreement included a provision that
the Company would supply product to the purchaser of Trade Secret and provide certain administrative services
for a transition period. For the fiscal year ended June 30, 2010, the Company generated revenue of $20.0 million
in product revenues, which represented 0.8 percent of consolidated revenues. The agreement was substantially
complete as of September 30, 2009.
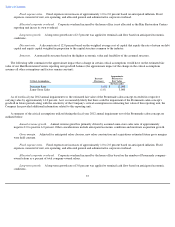
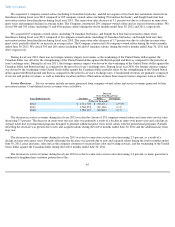
Percentage Increase
(Decrease) in Revenues
For the Years Ended
June 30,
Factor 2012 2011 2010
Acquisitions
0.7
%
1.1
%
0.8
%
Same
-
store sales
(3.1
)
(1.7
)
(3.2
)
New stores
1.2
0.6
0.7
Foreign currency
0.0
0.4
0.2
Franchise revenues
0.1
0.0
0.0
Closed salons
(2.2
)
(1.5
)
(0.9
)
Other
1.1
(0.3
)
(0.5
)
(2.2
)%
(1.4
)%
(2.9
)%