Supercuts 2012 Annual Report Download - page 42
Download and view the complete annual report
Please find page 42 of the 2012 Supercuts annual report below. You can navigate through the pages in the report by either clicking on the pages listed below, or by using the keyword search tool below to find specific information within the annual report.-
 1
1 -
2
-
3
-
4
-
5
-
6
-
7
-
8
-
9
-
10
-
11
-
12
-
13
-
14
-
15
-
16
-
17
-
18
-
19
-
20
-
21
-
22
-
23
-
24
-
25
-
26
-
27
-
28
-
29
-
30
-
31
-
 32
32 -
 33
33 -
 34
34 -
 35
35 -
 36
36 -
 37
37 -
 38
38 -
 39
39 -
 40
40 -
 41
41 -
 42
42 -
 43
43 -
 44
44 -
 45
45 -
 46
46 -
 47
47 -
 48
48 -
 49
49 -
 50
50 -
 51
51 -
 52
52 -
53
-
54
-
55
-
56
-
57
-
58
-
59
-
60
-
61
-
62
-
63
-
64
-
65
-
66
-
67
-
68
-
69
-
70
-
71
-
72
-
73
-
74
-
75
-
76
-
77
-
78
-
79
-
80
-
81
-
82
-
83
-
84
-
85
-
86
-
87
-
88
-
89
-
90
-
91
-
92
-
93
-
94
-
95
-
96
-
97
-
98
-
99
-
100
-
101
-
102
-
103
-
104
-
105
-
106
-
107
-
108
-
109
-
110
-
111
-
112
-
113
-
114
-
115
-
116
-
117
-
118
-
119
-
120
-
121
-
122
-
123
-
124
-
125
-
126
-
127
-
128
-
129
-
130
-
131
-
132
-
133
-
134
-
135
-
136
-
137
-
138
-
139
-
140
-
141
-
142
-
143
-
144
-
145
-
146
-
147
-
148
-
149
-
150
-
151
-
152
-
153
-
154
-
155
-
156
-
157
-
158
-
159
-
160
-
161
-
162
-
163
-
164
-
165
-
166
-
167
-
168
-
169
-
170
-
171
-
172
-
173
-
174
-
175
-
176
-
177
-
178
-
179
-
180
-
181
 |
 |

Table of Contents
The workers' compensation, general liability and employment practice liability analysis includes applying loss development factors to the
Company's historical claims data (total paid and incurred amounts per claim) for all policy years where the Company has not reached its
aggregate limits to project the future development of incurred claims. The workers' compensation analysis is performed for three models;
California, Texas and all other states. A variety of accepted actuarial methodologies are followed to determine these liabilities, including
several methods to predict the loss development factors for each policy period. These liabilities are determined by modeling the frequency
(number of claims) and severity (cost of claims), fitting statistical distributions to the experience, and then running simulations. A similar
analysis is performed for both general liability and employment practices liability; however, it is a single model for all liability claims rather
than the three separate models used for workers' compensation.
The health insurance analysis utilizes trailing twelve months of paid and 24 months of incurred medical and prescription claims to project
the amount of incurred but not yet reported claims liability amount. The lag factors are developed based on the Company's specific claim data
utilizing a completion factor methodology. The developed factor, expressed as a percentage of paid claims, is applied to the trailing twelve
months of paid claims to calculate the estimated liability amount. The calculated liability amount is reviewed for reasonableness based on
reserve adequacy ranges for historical periods by testing prior reserve levels against actual expenses to date.
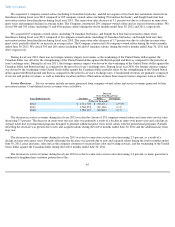
Although the Company does not expect the amounts ultimately paid to differ significantly from the estimates, self-insurance accruals
could be affected if future claims experience differs significantly from the historical trends and actuarial assumptions. For fiscal years 2012 and
2011, the Company recorded increases in expense from changes in estimates related to prior year open policy periods of $0.7 and $1.4 million,
respectively. For fiscal year 2010, the Company recorded a decrease in expense from changes in estimates related to prior year open policy
periods of $1.7 million. A 10.0 percent change in the self-insurance reserve would affect income from continuing operations before income
taxes and equity in (loss) income of affiliated companies by $4.8, $4.6, and $4.5 million for the three years ended June 30, 2012, 2011 and
2010, respectively. The Company updates loss projections twice each year and adjusts its recorded liability to reflect the current projections.
The updated loss projections consider new claims and developments associated with existing claims for each open policy period. As certain
claims can take years to settle, the Company has multiple policy periods open at any point in time.
Income Taxes
In determining income for financial statement purposes, management must make certain estimates and judgments. These estimates and
judgments occur in the calculation of certain tax liabilities and in the determination of the recoverability of certain deferred tax assets which
arise from temporary differences between the tax and financial statement recognition of revenue and expense.
Management must assess the likelihood that deferred tax assets will be recovered. If recovery is not likely, we must increase our provision
for taxes by recording a reserve, in the form of a valuation allowance, for the deferred tax assets that will not ultimately be recoverable. Should
there be a change in our ability to recover our deferred tax assets, our tax provision would increase in the period in which it is determined that
the recovery is not likely.
In addition, the calculation of tax liabilities involves dealing with uncertainties in the application of complex tax regulations. Management
recognizes a reserve for potential liabilities for anticipated tax audit issues in the United States and other tax jurisdictions based on our estimate
of whether additional taxes will be due. If payment of these amounts ultimately proves to be unnecessary, the reversal of the liabilities would
result in tax benefits being recognized in the period when we determine the liabilities are no longer necessary. If our estimate of tax liabilities
proves to be less than the ultimate assessment, a further charge to expense would result. In the United States, fiscal years 2009
40