Supercuts 2012 Annual Report Download - page 83
Download and view the complete annual report
Please find page 83 of the 2012 Supercuts annual report below. You can navigate through the pages in the report by either clicking on the pages listed below, or by using the keyword search tool below to find specific information within the annual report.-
 1
1 -
2
-
3
-
4
-
5
-
6
-
7
-
8
-
9
-
10
-
11
-
12
-
13
-
14
-
15
-
16
-
17
-
18
-
19
-
20
-
21
-
22
-
23
-
24
-
25
-
26
-
27
-
28
-
29
-
30
-
31
-
32
-
33
-
34
-
35
-
36
-
37
-
38
-
39
-
40
-
41
-
42
-
43
-
44
-
45
-
46
-
47
-
48
-
49
-
50
-
51
-
52
-
53
-
54
-
55
-
56
-
57
-
58
-
59
-
60
-
61
-
62
-
63
-
64
-
65
-
66
-
67
-
68
-
69
-
70
-
71
-
72
-
 73
73 -
 74
74 -
 75
75 -
 76
76 -
 77
77 -
 78
78 -
 79
79 -
 80
80 -
 81
81 -
 82
82 -
 83
83 -
 84
84 -
 85
85 -
 86
86 -
 87
87 -
 88
88 -
 89
89 -
 90
90 -
 91
91 -
 92
92 -
 93
93 -
94
-
95
-
96
-
97
-
98
-
99
-
100
-
101
-
102
-
103
-
104
-
105
-
106
-
107
-
108
-
109
-
110
-
111
-
112
-
113
-
114
-
115
-
116
-
117
-
118
-
119
-
120
-
121
-
122
-
123
-
124
-
125
-
126
-
127
-
128
-
129
-
130
-
131
-
132
-
133
-
134
-
135
-
136
-
137
-
138
-
139
-
140
-
141
-
142
-
143
-
144
-
145
-
146
-
147
-
148
-
149
-
150
-
151
-
152
-
153
-
154
-
155
-
156
-
157
-
158
-
159
-
160
-
161
-
162
-
163
-
164
-
165
-
166
-
167
-
168
-
169
-
170
-
171
-
172
-
173
-
174
-
175
-
176
-
177
-
178
-
179
-
180
-
181
 |
 |

Table of Contents
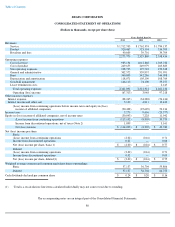
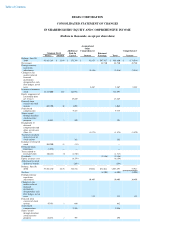
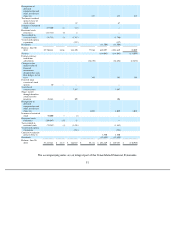
REGIS CORPORATION
CONSOLIDATED STATEMENT OF CHANGES
IN SHAREHOLDERS' EQUITY AND COMPREHENSIVE INCOME
(Dollars in thousands, except per share data)
Common Stock
Accumulated
Other
Comprehensive
Income
Additional
Paid-In
Capital Retained
Earnings
Comprehensive
Income
Shares Amount Total
Balance, June 30,
2009
43,881,364
$
2,194
$
151,394
$
51,855
$
597,417
$
802,860
$
(174,584
)
Net income
42,740
42,740
42,740
Foreign currency
translation
adjustments
(5,416
)
(5,416
)
(5,416
)
Changes in fair
market value of
financial
instruments
designated as cash
flow hedges, net of
taxes
2,467
2,467
2,467
Issuance of common
stock
13,225,000
661
162,932
163,593
Equity component of
convertible debt,
net of taxes
15,245
15,245
Proceeds from
exercise of stock
options
202,700
10
3,055
3,065
Stock-based
compensation
9,337
9,337
Shares issued
through franchise
stock incentive
program
16,053
1
290
291
Recognition of
deferred
compensation and
other, net of taxes
(Note 13)
(1,874
)
(1,874
)
(1,874
)
Tax benefit realized
upon exercise of
stock options
262
262
Issuance of restricted
stock
304,200
15
(15
)
—
Restricted stock
forfeitures
(1,976
)
—
—
—
Taxes related to
restricted stock
(66,161
)
(3
)
(1,710
)
(1,713
)
Dividends
(9,146
)
(9,146
)
Equity issuance costs
(8,154
)
(8,154
)
Adjustment to stock
option tax benefit
(264
)
(264
)
Balance, June 30,
2010
57,561,180
2,878
332,372
47,032
631,011
1,013,293
37,917
Net loss
(8,905
)
(8,905
)
(8,905
)
Foreign currency
translation
adjustments
30,405
30,405
30,405
Changes in fair
market value of
financial
instruments
designated as cash
flow hedges, net of
taxes
132
132
132
Proceeds from
exercise of stock
options
45,933
2
680
682
Stock-based
compensation
9,596
9,596
Shares issued
through franchise
stock incentive
program
24,472
1
397
398