Supercuts 2012 Annual Report Download - page 61
Download and view the complete annual report
Please find page 61 of the 2012 Supercuts annual report below. You can navigate through the pages in the report by either clicking on the pages listed below, or by using the keyword search tool below to find specific information within the annual report.-
 1
1 -
2
-
3
-
4
-
5
-
6
-
7
-
8
-
9
-
10
-
11
-
12
-
13
-
14
-
15
-
16
-
17
-
18
-
19
-
20
-
21
-
22
-
23
-
24
-
25
-
26
-
27
-
28
-
29
-
30
-
31
-
32
-
33
-
34
-
35
-
36
-
37
-
38
-
39
-
40
-
41
-
42
-
43
-
44
-
45
-
46
-
47
-
48
-
49
-
50
-
 51
51 -
 52
52 -
 53
53 -
 54
54 -
 55
55 -
 56
56 -
 57
57 -
 58
58 -
 59
59 -
 60
60 -
 61
61 -
 62
62 -
 63
63 -
 64
64 -
 65
65 -
 66
66 -
 67
67 -
 68
68 -
 69
69 -
 70
70 -
 71
71 -
72
-
73
-
74
-
75
-
76
-
77
-
78
-
79
-
80
-
81
-
82
-
83
-
84
-
85
-
86
-
87
-
88
-
89
-
90
-
91
-
92
-
93
-
94
-
95
-
96
-
97
-
98
-
99
-
100
-
101
-
102
-
103
-
104
-
105
-
106
-
107
-
108
-
109
-
110
-
111
-
112
-
113
-
114
-
115
-
116
-
117
-
118
-
119
-
120
-
121
-
122
-
123
-
124
-
125
-
126
-
127
-
128
-
129
-
130
-
131
-
132
-
133
-
134
-
135
-
136
-
137
-
138
-
139
-
140
-
141
-
142
-
143
-
144
-
145
-
146
-
147
-
148
-
149
-
150
-
151
-
152
-
153
-
154
-
155
-
156
-
157
-
158
-
159
-
160
-
161
-
162
-
163
-
164
-
165
-
166
-
167
-
168
-
169
-
170
-
171
-
172
-
173
-
174
-
175
-
176
-
177
-
178
-
179
-
180
-
181
 |
 |

Table of Contents
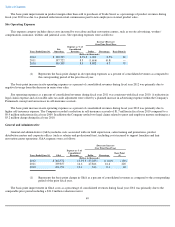
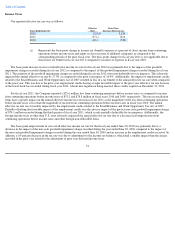
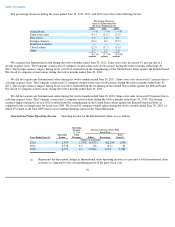
The percentage decreases during the years ended June 30, 2012, 2011, and 2010 were due to the following factors:
We acquired one International salon during the twelve months ended June 30, 2012. Same-store sales decreased 9.1 percent due to a
decline in guest visits. The Company constructed 13 company-owned salons (net of relocations) during the twelve months ended June 30,
2012. The foreign currency impact during fiscal year 2012 resulted from the strengthening of the United States dollar against the British Pound.
We closed 16 company-owned salons during the twelve months ended June 30, 2012.
We did not acquire any International salons during the twelve months ended June 30, 2011. Same-store sales decreased 3.1 percent due to
a decline in guest visits. The Company constructed 11 company-owned salons (net of relocations) during the twelve months ended June 30,
2011. The foreign currency impact during fiscal year 2011 resulted from the weakening of the United States dollar against the British Pound.
We closed 15 company-owned salons during the twelve months ended June 30, 2011.
We did not acquire any International salons during the twelve months ended June 30, 2010. Same-store sales decreased 3.8 percent due to
a decline in guest visits. The Company constructed 2 company-owned salons during the twelve months ended June 30, 2010. The foreign
currency impact during fiscal year 2010 resulted from the strengthening of the United States dollar against the British Pound and Euro as
compared to the exchange rates for fiscal year 2009. We closed 42 company-owned salons during the twelve months ended June 30, 2010, of
which 29 related to the June 2009 plan to close underperforming salons in the United Kingdom.
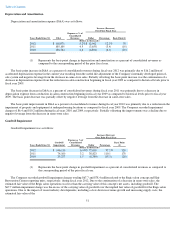
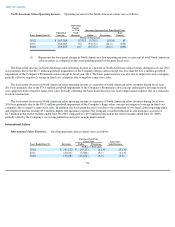
International Salon Operating Income. Operating income for the International salons was as follows:
59
Percentage (Decrease)
Increase in Revenues For
the Years Ended June 30,
2012 2011 2010
Acquisitions
—
%
—
%
—
%
Same
-
store sales
(9.1
)
(3.1
)
(3.8
)
New stores
1.9
1.0
0.1
Foreign currency
(0.3
)
0.3
(2.9
)
Franchise revenues
—
—
—
Closed salons
(2.3
)
(3.7
)
(7.6
)
Other
3.7
1.8
5.2
(6.1
)%
(3.7
)%
(9.0
)%
(Decrease) Increase Over Prior
Fiscal Year
Operating
Income
as % of
Total
Revenues
Years Ended June 30, Operating
Income Dollar Percentage Basis
Point(1)
(Dollars in thousands)
2012
$
2,505
1.8
%
$
(4,233
)
(62.8
)%
(270
)
2011
6,738
4.5
(41
)
(0.6
)
20
2010
6,779
4.3
52,260
114.9
3,080
(1) Represents the basis point change in International salon operating income as a percent of total International salon
revenues as compared to the corresponding period of the prior fiscal year.