Supercuts 2012 Annual Report Download - page 53
Download and view the complete annual report
Please find page 53 of the 2012 Supercuts annual report below. You can navigate through the pages in the report by either clicking on the pages listed below, or by using the keyword search tool below to find specific information within the annual report.-
 1
1 -
2
-
3
-
4
-
5
-
6
-
7
-
8
-
9
-
10
-
11
-
12
-
13
-
14
-
15
-
16
-
17
-
18
-
19
-
20
-
21
-
22
-
23
-
24
-
25
-
26
-
27
-
28
-
29
-
30
-
31
-
32
-
33
-
34
-
35
-
36
-
37
-
38
-
39
-
40
-
41
-
42
-
 43
43 -
 44
44 -
 45
45 -
 46
46 -
 47
47 -
 48
48 -
 49
49 -
 50
50 -
 51
51 -
 52
52 -
 53
53 -
 54
54 -
 55
55 -
 56
56 -
 57
57 -
 58
58 -
 59
59 -
 60
60 -
 61
61 -
 62
62 -
 63
63 -
64
-
65
-
66
-
67
-
68
-
69
-
70
-
71
-
72
-
73
-
74
-
75
-
76
-
77
-
78
-
79
-
80
-
81
-
82
-
83
-
84
-
85
-
86
-
87
-
88
-
89
-
90
-
91
-
92
-
93
-
94
-
95
-
96
-
97
-
98
-
99
-
100
-
101
-
102
-
103
-
104
-
105
-
106
-
107
-
108
-
109
-
110
-
111
-
112
-
113
-
114
-
115
-
116
-
117
-
118
-
119
-
120
-
121
-
122
-
123
-
124
-
125
-
126
-
127
-
128
-
129
-
130
-
131
-
132
-
133
-
134
-
135
-
136
-
137
-
138
-
139
-
140
-
141
-
142
-
143
-
144
-
145
-
146
-
147
-
148
-
149
-
150
-
151
-
152
-
153
-
154
-
155
-
156
-
157
-
158
-
159
-
160
-
161
-
162
-
163
-
164
-
165
-
166
-
167
-
168
-
169
-
170
-
171
-
172
-
173
-
174
-
175
-
176
-
177
-
178
-
179
-
180
-
181
 |
 |

Table of Contents
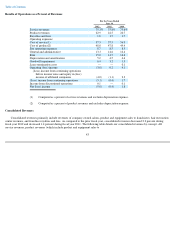
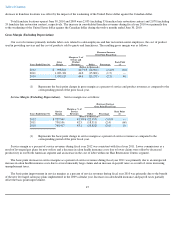
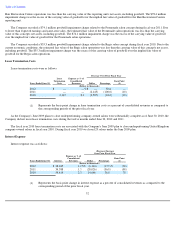
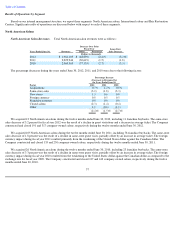
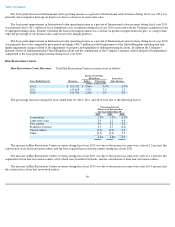
Depreciation and Amortization
Depreciation and amortization expense (D&A) was as follows:
The basis point increase in D&A as a percent of consolidated revenues during fiscal year 2012 was primarily due to $16.2 million of
accelerated depreciation expense in the current year resulting from the useful life adjustment of the Company's internally developed point-of-
sale system and negative leverage from the decrease in same-store sales. Partially offsetting the basis point increase was the continuation of a
decrease in depreciation expense from the reduction in salon construction beginning in fiscal year 2009 as compared to historical levels prior to
fiscal year 2009.
The basis point decrease in D&A as a percent of consolidated revenues during fiscal year 2011 was primarily due to a decrease in
depreciation expense from a reduction in salon construction beginning in fiscal year 2009 as compared to historical levels prior to fiscal year
2009. The basis point decrease was partially offset by negative leverage from the decrease in same-store sales.
The basis point improvement in D&A as a percent of consolidated revenues during fiscal year 2010 was primarily due to a reduction in the
impairment of property and equipment at underperforming locations as compared to fiscal year 2009. The Company recorded impairment
charges of $6.4 and $10.2 million during fiscal years 2010 and 2009, respectively. Partially offsetting the improvements was a decline due to
negative leverage from the decrease in same-store sales.
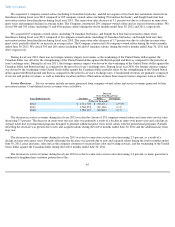
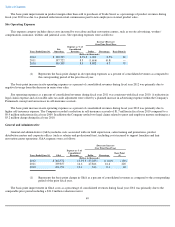
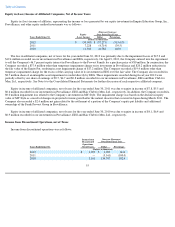
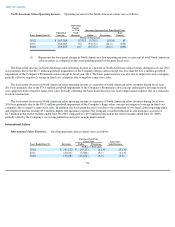
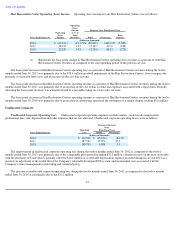
Goodwill Impairment
Goodwill impairment was as follows:
The Company recorded goodwill impairment charges totaling $67.7 and $78.4 million related to the Regis salon concept and Hair
Restoration Centers reporting units, respectively, during fiscal year 2012. Due to the continuation of a decrease in same-store sales, the
estimated fair value of the Regis salon operations was less than the carrying value of this concept's net assets, including goodwill. The
$67.7 million impairment charge was the excess of the carrying value of goodwill over the implied fair value of goodwill for the Regis salon
operations. Due to the impact of recent industry developments, including a slow down in revenue growth and increasing supply costs, the
estimated fair value of the
51
Increase (Decrease)
Over Prior Fiscal Year
Years Ended June 30, D&A
Expense as % of
Consolidated
Revenues Dollar Percentage
Basis Point(1)
(Dollars in thousands)
2012
$
118,071
5.2
%
$
12,962
12.3
%
70
2011
105,109
4.5
(3,655
)
(3.4
)
(10
)
2010
108,764
4.6
(6,891
)
(6.0
)
(20
)
(1) Represents the basis point change in depreciation and amortization as a percent of consolidated revenues as
compared to the corresponding period of the prior fiscal year.
Increase (Decrease)
Over Prior Fiscal Year
Years Ended June 30, Goodwill
Impairment
Expense as % of
Consolidated
Revenues Dollar Percentage Basis Point
(1)
(Dollars in thousands)
2012
$
146,110
6.4
%
$
72,010
97.2
%
320
2011
74,100
3.2
38,823
110.1
170
2010
35,277
1.5
(6,384
)
(15.3
)
(20
)
(1) Represents the basis point change in goodwill impairment as a percent of consolidated revenues as compared to
the corresponding period of the prior fiscal year.