Supercuts 2012 Annual Report Download - page 109
Download and view the complete annual report
Please find page 109 of the 2012 Supercuts annual report below. You can navigate through the pages in the report by either clicking on the pages listed below, or by using the keyword search tool below to find specific information within the annual report.-
 1
1 -
2
-
3
-
4
-
5
-
6
-
7
-
8
-
9
-
10
-
11
-
12
-
13
-
14
-
15
-
16
-
17
-
18
-
19
-
20
-
21
-
22
-
23
-
24
-
25
-
26
-
27
-
28
-
29
-
30
-
31
-
32
-
33
-
34
-
35
-
36
-
37
-
38
-
39
-
40
-
41
-
42
-
43
-
44
-
45
-
46
-
47
-
48
-
49
-
50
-
51
-
52
-
53
-
54
-
55
-
56
-
57
-
58
-
59
-
60
-
61
-
62
-
63
-
64
-
65
-
66
-
67
-
68
-
69
-
70
-
71
-
72
-
73
-
74
-
75
-
76
-
77
-
78
-
79
-
80
-
81
-
82
-
83
-
84
-
85
-
86
-
87
-
88
-
89
-
90
-
91
-
92
-
93
-
94
-
95
-
96
-
97
-
98
-
 99
99 -
 100
100 -
 101
101 -
 102
102 -
 103
103 -
 104
104 -
 105
105 -
 106
106 -
 107
107 -
 108
108 -
 109
109 -
 110
110 -
 111
111 -
 112
112 -
 113
113 -
 114
114 -
 115
115 -
 116
116 -
 117
117 -
 118
118 -
 119
119 -
120
-
121
-
122
-
123
-
124
-
125
-
126
-
127
-
128
-
129
-
130
-
131
-
132
-
133
-
134
-
135
-
136
-
137
-
138
-
139
-
140
-
141
-
142
-
143
-
144
-
145
-
146
-
147
-
148
-
149
-
150
-
151
-
152
-
153
-
154
-
155
-
156
-
157
-
158
-
159
-
160
-
161
-
162
-
163
-
164
-
165
-
166
-
167
-
168
-
169
-
170
-
171
-
172
-
173
-
174
-
175
-
176
-
177
-
178
-
179
-
180
-
181
 |
 |

Table of Contents
NOTES TO CONSOLIDATED FINANCIAL STATEMENTS (Continued)
6. INVESTMENTS IN AND LOANS TO AFFILIATES (Continued)
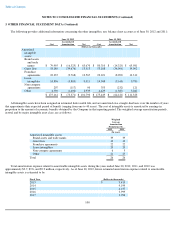
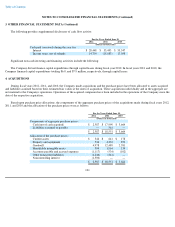
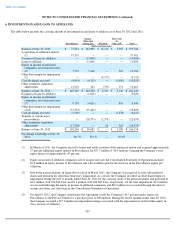
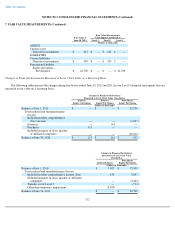
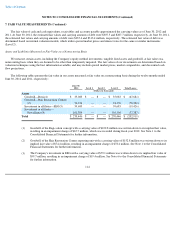
The table below presents the summarized financial information of the equity method investees as of June 30, 2012 2011, and 2010. The
financial information of the equity investees was based on results as of and for the twelve months ended June 30.
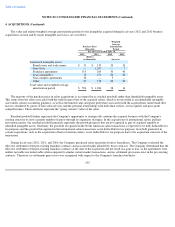
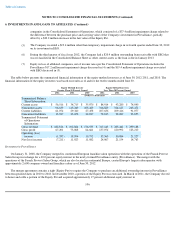
Investment in Provalliance
On January 31, 2008, the Company merged its continental European franchise salon operations with the operations of the Franck Provost
Salon Group in exchange for a 30.0 percent equity interest in the newly formed Provalliance entity (Provalliance). The merger with the
operations of the Franck Provost Salon Group, which are also located in continental Europe, created Europe's largest salon operator with
approximately 2,600 company-owned and franchise salons as of June 30, 2012.
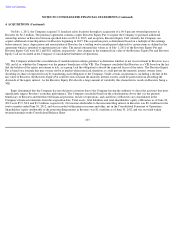
The merger agreement contains a right (Equity Put) to require the Company to purchase an additional ownership interest in Provalliance
between specified dates in 2010 to 2018. In December 2010, a portion of the Equity Put was exercised. In March of 2011, the Company elected
to honor and settle a portion of the Equity Put and acquired approximately 17 percent additional equity interest in
106
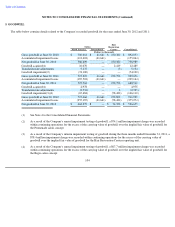
companies in the Consolidated Statement of Operations, which consisted of a $37.4 million impairment charge related to
the difference between the purchase price and carrying value of the Company's investment in Provalliance, partially
offset by a $20.2 million decrease in the fair value of the Equity Put.
(5)
The Company recorded a $19.4 million other than temporary impairment charge in its fourth quarter ended June 30, 2012
on its investment in EEG.
(6) During the third quarter of fiscal year 2012, the Company had a $20.4 million outstanding loan receivable with EEG that
was reclassified in the Consolidated Balance Sheet as other current assets as the loan is due in January 2013.
(7) Equity in loss of affiliated companies, net of income taxes per the Consolidated Statement of Operations includes the
Provalliance $17.2 million net impairment charge discussed in (4) and the $19.4 million impairment charge associated
with EEG discussed in (5).
Equity Method Investee
Greater Than 50 Percent Owned Equity Method Investees
Less Than 50 Percent Owned
2012 2011 2010 2012 2011 2010
(Dollars in thousands)
Summarized Balance
Sheet Information:
Current assets
$
56,516
$
34,715
$
35,070
$
84,914
$
93,280
$
74,040
Noncurrent assets
96,639
113,249
105,469
316,829
314,127
263,472
Current liabilities
61,074
29,340
27,458
107,636
109,416
91,077
Noncurrent liabilities
13,947
33,658
32,017
78,815
98,269
93,055
Summarized Statement
of Operations
Information:
Gross revenue
$
182,326
$
192,864
$
176,535
$
317,143
$
283,442
$
299,188
Gross profit
67,201
73,068
64,661
137,074
120,992
123,210
Operating (loss)
income
(1,335
)
18,994
19,752
35,569
30,084
21,227
Net (loss) income
(7,211
)
11,023
11,082
24,067
21,154
14,763