Qantas 2009 Annual Report Download - page 89
Download and view the complete annual report
Please find page 89 of the 2009 Qantas annual report below. You can navigate through the pages in the report by either clicking on the pages listed below, or by using the keyword search tool below to find specific information within the annual report.-
 1
1 -
2
-
3
-
4
-
5
-
6
-
7
-
8
-
9
-
10
-
11
-
12
-
13
-
14
-
15
-
16
-
17
-
18
-
19
-
20
-
21
-
22
-
23
-
24
-
25
-
26
-
27
-
28
-
29
-
30
-
31
-
32
-
33
-
34
-
35
-
36
-
37
-
38
-
39
-
40
-
41
-
42
-
43
-
44
-
45
-
46
-
47
-
48
-
49
-
50
-
51
-
52
-
53
-
54
-
55
-
56
-
57
-
58
-
59
-
60
-
61
-
62
-
63
-
64
-
65
-
66
-
67
-
68
-
69
-
70
-
71
-
72
-
73
-
74
-
75
-
76
-
77
-
78
-
 79
79 -
 80
80 -
 81
81 -
 82
82 -
 83
83 -
 84
84 -
 85
85 -
 86
86 -
 87
87 -
 88
88 -
 89
89 -
 90
90 -
 91
91 -
 92
92 -
 93
93 -
 94
94 -
 95
95 -
 96
96 -
 97
97 -
 98
98 -
 99
99 -
100
-
101
-
102
-
103
-
104
-
105
-
106
-
107
-
108
-
109
-
110
-
111
-
112
-
113
-
114
-
115
-
116
-
117
-
118
-
119
-
120
-
121
-
122
-
123
-
124
-
125
-
126
-
127
-
128
-
129
-
130
-
131
-
132
-
133
-
134
-
135
-
136
-
137
-
138
-
139
-
140
-
141
-
142
-
143
-
144
-
145
-
146
-
147
-
148
-
149
-
150
-
151
-
152
-
153
-
154
-
155
-
156
-
157
-
158
-
159
-
160
-
161
-
162
-
163
-
164
 |
 |

87 Qantas Annual Report 2009
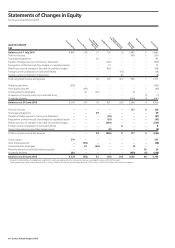
Statements of Changes in Equity
for the year ended 30 June 2009
QANTAS
$M
Balance as at 1 July 2007 4,481 (33) 27 122 65 4,662
Profit for the year – – – – 1,308 1,308
Share-based payments – – 62 – – 62
Transfer of hedge reserve to the Income Statement1 – – – (209) – (209)
Recognition of effective cash flow hedges on capitalised assets – – – 71 – 71
Effective portion of changes in fair value of cash flow hedges – – – 437 – 437
Total recognised income and expense – – 62 299 1,308 1,669
Shares bought back (505) – – – – (505)
Own shares acquired – (69) – – – (69)
Shares vested to employees – 41 (36) – (5) –
Dividends declared – – – – (640) (640)
Balance as at 30 June 2008 3,976 (61) 53 421 728 5,117
Profit for the year – – – – 484 484
Share-based payments – – 59 – – 59
Transfer of hedge reserve to the Income Statement1 – – – (68) – (68)
Recognition of effective cash flow hedges on capitalised assets – – – (61) – (61)
Effective portion of changes in fair value of cash flow hedges – – – (300) – (300)
Total recognised income and expense – – 59 (429) 484 114
Shares issued 517 – – – – 517
Own shares acquired – (58) – – – (58)
Shares vested to employees – 61 (60) – (1) –
Dividends declared 236 – – – (439) (203)
Balance as at 30 June 2009 4,729 (58) 52 (8) 772 5,487
1. Amounts transferred from the hedge reserve to the Income Statements totalled $68 million (2008: $209 million).
These amounts were allocated to revenue of $288 million (20 08: ($125) million and fuel expenditure of ($220) million (200 8: $334 million) in the Income Statement s.
Issued Capital
Treasury Shares
Employee
Compensation
Reserve
Hedge Reserve
Retained
Earnings
Total Equity