Qantas 2009 Annual Report Download - page 154
Download and view the complete annual report
Please find page 154 of the 2009 Qantas annual report below. You can navigate through the pages in the report by either clicking on the pages listed below, or by using the keyword search tool below to find specific information within the annual report.-
 1
1 -
2
-
3
-
4
-
5
-
6
-
7
-
8
-
9
-
10
-
11
-
12
-
13
-
14
-
15
-
16
-
17
-
18
-
19
-
20
-
21
-
22
-
23
-
24
-
25
-
26
-
27
-
28
-
29
-
30
-
31
-
32
-
33
-
34
-
35
-
36
-
37
-
38
-
39
-
40
-
41
-
42
-
43
-
44
-
45
-
46
-
47
-
48
-
49
-
50
-
51
-
52
-
53
-
54
-
55
-
56
-
57
-
58
-
59
-
60
-
61
-
62
-
63
-
64
-
65
-
66
-
67
-
68
-
69
-
70
-
71
-
72
-
73
-
74
-
75
-
76
-
77
-
78
-
79
-
80
-
81
-
82
-
83
-
84
-
85
-
86
-
87
-
88
-
89
-
90
-
91
-
92
-
93
-
94
-
95
-
96
-
97
-
98
-
99
-
100
-
101
-
102
-
103
-
104
-
105
-
106
-
107
-
108
-
109
-
110
-
111
-
112
-
113
-
114
-
115
-
116
-
117
-
118
-
119
-
120
-
121
-
122
-
123
-
124
-
125
-
126
-
127
-
128
-
129
-
130
-
131
-
132
-
133
-
134
-
135
-
136
-
137
-
138
-
139
-
140
-
141
-
142
-
143
-
 144
144 -
 145
145 -
 146
146 -
 147
147 -
 148
148 -
 149
149 -
 150
150 -
 151
151 -
 152
152 -
 153
153 -
 154
154 -
 155
155 -
 156
156 -
 157
157 -
 158
158 -
 159
159 -
 160
160 -
 161
161 -
 162
162 -
 163
163 -
 164
164
 |
 |

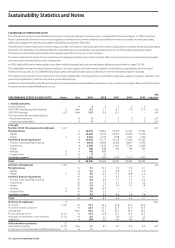
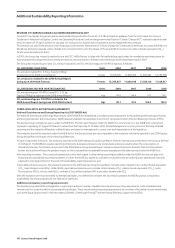
152 Qantas Annual Report 2009
Sustainability Statistics and Notes
GRI
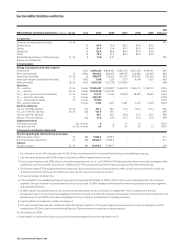
PERFORMANCE STATISTICS AND NOTES Notes Unit 2009 2008 2007 2006 2005 indicator1
SUSTAINABILITY REPORTING SCOPE
ThisistheQantasGroup’sthirdsustainabilityreportand,continuingtheapproachofpreviousyears,isintegratedwiththeAnnualReport.In2009,theAnnual
Reportispresentedforthersttimeonamicrosite(qantas.com/annualreport),whereadditionalsustainabilityinformationisprovided,includingcasestudies,
stakeholderengagementmethodsandadetailedGlobalReportingInitiative(GRI)Index.
Theselectionofcontentandkeyperformancemeasuresismadeonthebasisofmateriality,stakeholderinterestandguidanceprovidedbytheleadingsustainability
framework,theGlobalReportingInitiative(GRI)G3SustainabilityReportingGuidelines(www.globalreporting.org).TheGRIprovidesagenerallyaccepted
frameworkforsustainabilityreportingthatcanbeusedbyorganisationsofanysize,sectororlocation.
ThemetricsalignwiththeQantasGroup’soverallbusinessstrategyandmaterialimpactareasincludingsafety,security,environment,social(includingourpeople,
customers and community) and economic development.
In2009,additionalkeyperformancestatisticshavebeenincludedforpeopleandcustomerandstatisticdenitionsareprovidedonpages154-156.
Thesustainabilityinformationandperformancestatisticsinthisreportapplytoallwholly-ownedoperationsoftheQantasGroupgloballyandfortheJetset
TravelworldGroupandisforthe2008/09nancialyearunlessotherwiseindicated.Approximately90percentofemployeesarebasedinAustralia.
Thestatisticsareprovidedfortheinformationofawiderangeofstakeholdersincludingcustomers,shareholders,employees,suppliers,regulators,politicians,non-
government organisations, financiers and various special interest groups.
FeedbackonthesustainabilityinformationpresentedintheAnnualReportandtheadditionaldisclosuresonthemicrositeisencouraged.PleasecontacttheQantas
Groupbywritingtosustainability@qantas.com.au.
1. Health and safety
Aviation fatalities # 0 0 0 0 0
OHSLTIFR(AustraliaandNewZealand) 2 Rate 4.2 5.1 6.3 7.9 12.2 LA7
OHSSIFR(Australia) 3,26 Rate 13.5 12.8 12.3 – – LA7
Occupational health and safety fatalities
–Permanentemployees # 0 1 0 0 0 LA7
–Contractors(embedded) # 0 0 0 1 0 LA7
2. People
Number of full time equivalent employees 4, 26 LA1
Flying business # 16,216 16,894 16,415 16,345 16,462
–Qantas # 13,206 14,159 14,457 14,940 15,296
–Jetstar 5 # 3,010 2,735 1,958 1,405 1,166
Portfolio & service businesses # 15,452 15,577 14,613 15,430 16,522
–Airports,Catering&FlightTraining # 8,145 8,656 8,394 8,897 9,355
–Engineering # 5,708 5,543 5,403 5,764 6,424
–Freight # 786 838 816 769 743
–Holidays 6 # 742 487 – – –
–FrequentFlyer 6 # 71 53 – – –
Corporate support # 1,362 1,824 2,074 2,250 2,240
Total # 33,030 34,295 33,102 34,025 35,224
Attrition of employees 7, 26 LA2
Flying business % 5.1 10.3 7.4 5.8 6.1
–Qantas % 4.2 9.7 6.8 5.2 5.6
–Jetstar 5 % 9.0 12.9 11.2 10.8 11.4
Portfolio & service businesses % 4.5 7.0 6.3 5.3 4.1
–Airports,Catering&FlightTraining % 4.8 6.8 7.1 5.9 4.4
–Engineering % 3.1 5.6 4.1 3.6 2.4
–Freight % 5.8 6.7 5.4 5.2 5.4
–Holidays 6 % 9.8 15.4 – – –
–FrequentFlyer 6 % 3.0 2.0 – – –
Corporate support % 4.7 8.0 8.4 7.4 5.4
Total % 4.8 8.7 6.9 5.6 5.1
Diversity of employees 8 LA13
% women 9, 26 % 41.7 42.2 41.8 41.3 40.4
% women in senior positions % 22.3 22.7 22.5 22.6 23.3
Average age Years 42.2 41.2 41.2 41.0 40.4
%whoworkpart-time 10,26 % 12.9 12.8 12.3 12.4 12.2
%eligibleforretirementinnextveyears 11,26 % 4.4 3.7 3.4 2.9 2.5
Indigenous # 269 203 141 136 132
Other workforce statistics 12
Absenteeism(Qantas) 10,26 Days 8.9 8.7 8.7 8.6 8.3 LA7
%ExecutiveCommitteepositionslledbytalentpool 13 % 70 – – – –