Qantas 2009 Annual Report Download - page 59
Download and view the complete annual report
Please find page 59 of the 2009 Qantas annual report below. You can navigate through the pages in the report by either clicking on the pages listed below, or by using the keyword search tool below to find specific information within the annual report.-
 1
1 -
2
-
3
-
4
-
5
-
6
-
7
-
8
-
9
-
10
-
11
-
12
-
13
-
14
-
15
-
16
-
17
-
18
-
19
-
20
-
21
-
22
-
23
-
24
-
25
-
26
-
27
-
28
-
29
-
30
-
31
-
32
-
33
-
34
-
35
-
36
-
37
-
38
-
39
-
40
-
41
-
42
-
43
-
44
-
45
-
46
-
47
-
48
-
 49
49 -
 50
50 -
 51
51 -
 52
52 -
 53
53 -
 54
54 -
 55
55 -
 56
56 -
 57
57 -
 58
58 -
 59
59 -
 60
60 -
 61
61 -
 62
62 -
 63
63 -
 64
64 -
 65
65 -
 66
66 -
 67
67 -
 68
68 -
 69
69 -
70
-
71
-
72
-
73
-
74
-
75
-
76
-
77
-
78
-
79
-
80
-
81
-
82
-
83
-
84
-
85
-
86
-
87
-
88
-
89
-
90
-
91
-
92
-
93
-
94
-
95
-
96
-
97
-
98
-
99
-
100
-
101
-
102
-
103
-
104
-
105
-
106
-
107
-
108
-
109
-
110
-
111
-
112
-
113
-
114
-
115
-
116
-
117
-
118
-
119
-
120
-
121
-
122
-
123
-
124
-
125
-
126
-
127
-
128
-
129
-
130
-
131
-
132
-
133
-
134
-
135
-
136
-
137
-
138
-
139
-
140
-
141
-
142
-
143
-
144
-
145
-
146
-
147
-
148
-
149
-
150
-
151
-
152
-
153
-
154
-
155
-
156
-
157
-
158
-
159
-
160
-
161
-
162
-
163
-
164
 |
 |

57 Qantas Annual Report 2009
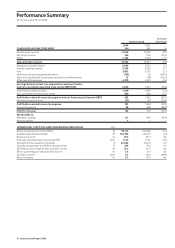
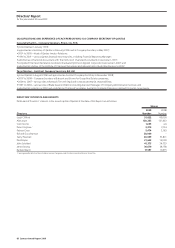
Performance Summary
for the year ended 30 June 2009
Increase/
Qantas Group (decrease)
2009 2008
CONDENSED INCOME STATEMENT $M $M %
Net passenger revenue 11,604 12,709 (8.7)
Net freight revenue 764 959 (20.3)
Other 2,184 1,959 11.5
Sales and other income 14,552 15,627 (6.9)
Manpower and staff related 3,684 3,533 4.3
Aircraft operating variable 2,834 2,608 8.7
Fuel 3,602 3,701 (2.7)
Ineffective and non-designated derivatives (105) 55 (290.9)
Share of net loss/(profit) of associates and jointly controlled entities 15 (28) (153.6)
Other operating expenses 2,479 2,527 (0.2)
Earnings before interest, tax, depreciation and amortisation
and non-cancellable operating lease rentals (EBITDAR) 2,043 3,231 (36.8)
Depreciation and amortisation 1,390 1,469 (5.4)
Non-cancellable operating lease rentals 450 400 12.5
Profit before related income tax expense and net finance (costs)/income (EBIT) 203 1,362 (85.1)
Net finance (costs)/income (22) 4 6 147. 8
Profit before related income tax expense 181 1,408 (87.1)
Income tax expense 58 438 (86.8)
Profit for the year 123 970 (87.3)
Attributable to:
Members of Qantas 117 969 (87.9)
Minority interest 6 1 –
OPERATIONAL STATISTICS AND PERFORMANCE INDICATORS Unit
Revenue passenger kilometres (RPKs) M 99,176 102,466 (3.2)
Available seat kilometres (ASKs) M 124,594 127,019 (1.9)
Revenue seat factor % 79.6 80.7 n/a
Passenger yield (passenger revenue per RPK) cents 11.30 11.81 (4 .3)
Average full time equivalent employees # 33,966 33,670 0.9
Operational passenger aircraft fleet at balance date # 229 224 2.2
EDITDAR as a percentage of sales and other income % 14.0 20.7 n/a
EBIT as a percentage of sales and other income % 1.4 8.7 n/a
Earnings per share cents 5.6 49.0 (88.6)
Return on equity % 2 .1 16.9 n/a