Qantas 2009 Annual Report Download - page 155
Download and view the complete annual report
Please find page 155 of the 2009 Qantas annual report below. You can navigate through the pages in the report by either clicking on the pages listed below, or by using the keyword search tool below to find specific information within the annual report.-
 1
1 -
2
-
3
-
4
-
5
-
6
-
7
-
8
-
9
-
10
-
11
-
12
-
13
-
14
-
15
-
16
-
17
-
18
-
19
-
20
-
21
-
22
-
23
-
24
-
25
-
26
-
27
-
28
-
29
-
30
-
31
-
32
-
33
-
34
-
35
-
36
-
37
-
38
-
39
-
40
-
41
-
42
-
43
-
44
-
45
-
46
-
47
-
48
-
49
-
50
-
51
-
52
-
53
-
54
-
55
-
56
-
57
-
58
-
59
-
60
-
61
-
62
-
63
-
64
-
65
-
66
-
67
-
68
-
69
-
70
-
71
-
72
-
73
-
74
-
75
-
76
-
77
-
78
-
79
-
80
-
81
-
82
-
83
-
84
-
85
-
86
-
87
-
88
-
89
-
90
-
91
-
92
-
93
-
94
-
95
-
96
-
97
-
98
-
99
-
100
-
101
-
102
-
103
-
104
-
105
-
106
-
107
-
108
-
109
-
110
-
111
-
112
-
113
-
114
-
115
-
116
-
117
-
118
-
119
-
120
-
121
-
122
-
123
-
124
-
125
-
126
-
127
-
128
-
129
-
130
-
131
-
132
-
133
-
134
-
135
-
136
-
137
-
138
-
139
-
140
-
141
-
142
-
143
-
144
-
 145
145 -
 146
146 -
 147
147 -
 148
148 -
 149
149 -
 150
150 -
 151
151 -
 152
152 -
 153
153 -
 154
154 -
 155
155 -
 156
156 -
 157
157 -
 158
158 -
 159
159 -
 160
160 -
 161
161 -
 162
162 -
 163
163 -
 164
164
 |
 |

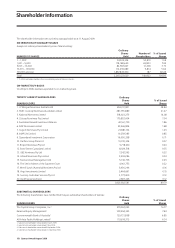
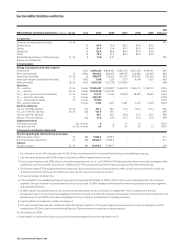
153 Qantas Annual Report 2009
Sustainability Statistics and Notes
3. Customer
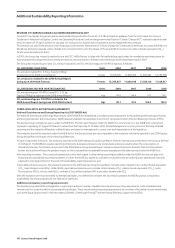
Domestic on-time arrivals (Australia) 10, 26 PR5
Qantas Group % 80.4 79.4 86.2 84.9 84.5
Qantas % 81.0 79.6 87.1 85.9 84.9
QantasLink % 80.9 80.6 86.0 83.6 83.6
Jetstar % 78.2 76.5 84.5 84.9 85.3
Mishandledbagslesper1,000passengers 14,26 # 7.50 8.31 – – – PR5
(QantasandQantasLink)
4. Environment
Energy consumption and other impacts
Aviation fuel 000L 4,695,383 4,849,430 4,680,270 4,561,238 4,392,991 EN3
Electricity(Australia) 15 MWh 240,005 248,007 246,776 236,858 231,095 EN3
Naturalgas(Australia) 16,26 Gj 308,877 333,013 361,353 289,463 292,959 EN3
Airport ground petrol and diesel (Australia) 17 000L 7,349 7,233 7,127 6,998 7,023 EN3
Water(Australia) 18,26 000L 1,070,335 1,152,278 1,215,820 – – EN8
Emissions
CO2–aviation 19,26 Tonnes 11,905,237 12,295, 827 11, 8 66,918 11,5 65,110 11,13 8,517 EN16
CO2-e–aviation 20,26 Tonnes 12,027,918 12,422,533 – – – EN16
CO2-e–airportgroundvehicles(Australia) 21,26 Tonnes 19,577 19,236 18,964 18,595 18,640 EN16
CO2-e–electricity(Australia) 10 Tonnes 228,397 – – – – EN16
CO2-e–naturalgas(Australia) 10 Tonnes 15,855 – – – – EN16
NOx–aviation(Qantas) Tonnes 3,413 3,511 3,387 3,273 3,294 EN20
Aviation efficiency
CO2 per 100 RTKs (Qantas) 19, 26 Kgs 101.7 98.1 97.4 100.2 102.2 EN5
CO2-e per 100 RTKs (Qantas) 20, 26 Kgs 102.8 99.1 – – – EN5
Fuelper100RTKs(Qantas) L 40.1 38.7 38.4 39.5 40.3 EN5
NOxperLTOcycle(Qantas) Kgs 21.8 22.6 22.5 22.4 22.0 EN5
Unplanned events
Fueljettison(Qantas) No.oftimes 9 4 11 13 – EN23
Fuelspillsreported 22 No.oftimes 60 77 67 65 53 EN23
5. Economic contribution (Australia)
Tourism spending by Qantas Group passengers
Nationalexportrevenue 23 $M 5,828.2 5,976.2 – – – EC1
Domestictravellerexpenditure 24 $M 18,622.3 17,256.2 – – – EC1
Indirect
Economic output 25, 26 $M 30,559.2 32,816.7 – – – EC9
GRI
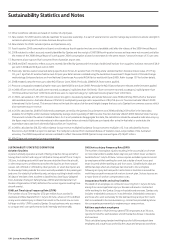
PERFORMANCE STATISTICS AND NOTES continued Notes Unit 2009 2008 2007 2006 2005 Indicator1
1.ForinformationontheGRIindicators,refertoGRIG3ReportingFrameworkforSustainabilityReporting,www.globalreporting.org.
2.Losttimeinjuryfrequencyrate(LTIFR)relatestoAustralianandNewZealandoperationsonly.
3.Seriousinjuryfrequencyrate(SIFR)relatestoAustralianoperationsonly.Asof1July2008,theSIFRgureexcludesinjuriesincurredbyemployeeswhile
travellingforworkbutoutsideofworkhours.2008and2007SIFRcomparativeshavebeenrestatedtoaligntothisrevisedmethodology.
4.Fulltimeequivalent(FTE)employeeshavebeenrestatedforthecurrentandpreviousnancialyearstoreectactualhoursworkedbythecasualand
temporaryworkforce.Previously,estimatedhourswereusedforcasualandtemporaryworkers.
5. Includes employees of Jetstar Asia.
6.FTE’sandattritionforHolidaysandFrequentFlyerwerenotseparatelyidentiablefor2005to2007asthesewereembeddedwithinotherbusiness
segments.TheyarehoweverincludedwithintheQantasGrouptotals.In2008,HolidaysandFrequentFlyerwererecognisedasstandalonesegments
and separately disclosed.
7.In2009,attritionhasreplacedturnoverasaworkforceplanningstatisticandasanindicatorofengagement.Thisisconsistentwiththenew
managementteam’sfocusonemployeeengagement.Attritionisbasedonnumberofemployeesandexcludesinvoluntaryterminationsdisclosedinthe
QantasGroup15April2009mediareleaseregardingtheGroup’sresponsetodeteriorationintradingconditions.
8.Diversitystatisticsarebasedonnumberofemployees.
9.Prioryearcomparativeshavebeenrestatedtoreectthechangeindenitionofthepercentageofwomenbasedonnumberofemployeesin2009
comparedtoaFTEbasisusedinpreviousAnnualReports.Thiswastoensureconsistencyofpeoplestatistics.
10. New statistic for 2009.
11. New statistic for 2009 which replaces previously reported percentage of part-time employees over 55.