Qantas 2009 Annual Report Download - page 102
Download and view the complete annual report
Please find page 102 of the 2009 Qantas annual report below. You can navigate through the pages in the report by either clicking on the pages listed below, or by using the keyword search tool below to find specific information within the annual report.-
 1
1 -
2
-
3
-
4
-
5
-
6
-
7
-
8
-
9
-
10
-
11
-
12
-
13
-
14
-
15
-
16
-
17
-
18
-
19
-
20
-
21
-
22
-
23
-
24
-
25
-
26
-
27
-
28
-
29
-
30
-
31
-
32
-
33
-
34
-
35
-
36
-
37
-
38
-
39
-
40
-
41
-
42
-
43
-
44
-
45
-
46
-
47
-
48
-
49
-
50
-
51
-
52
-
53
-
54
-
55
-
56
-
57
-
58
-
59
-
60
-
61
-
62
-
63
-
64
-
65
-
66
-
67
-
68
-
69
-
70
-
71
-
72
-
73
-
74
-
75
-
76
-
77
-
78
-
79
-
80
-
81
-
82
-
83
-
84
-
85
-
86
-
87
-
88
-
89
-
90
-
91
-
 92
92 -
 93
93 -
 94
94 -
 95
95 -
 96
96 -
 97
97 -
 98
98 -
 99
99 -
 100
100 -
 101
101 -
 102
102 -
 103
103 -
 104
104 -
 105
105 -
 106
106 -
 107
107 -
 108
108 -
 109
109 -
 110
110 -
 111
111 -
 112
112 -
113
-
114
-
115
-
116
-
117
-
118
-
119
-
120
-
121
-
122
-
123
-
124
-
125
-
126
-
127
-
128
-
129
-
130
-
131
-
132
-
133
-
134
-
135
-
136
-
137
-
138
-
139
-
140
-
141
-
142
-
143
-
144
-
145
-
146
-
147
-
148
-
149
-
150
-
151
-
152
-
153
-
154
-
155
-
156
-
157
-
158
-
159
-
160
-
161
-
162
-
163
-
164
 |
 |

100 Qantas Annual Report 2009
Notes to the Financial Statements
for the year ended 30 June 2009
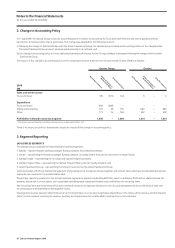
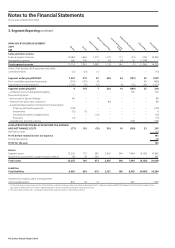
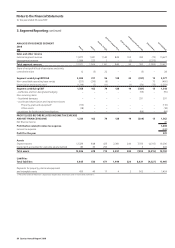
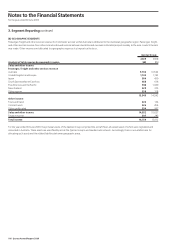
3. Segment Reporting continued
(B) GEOGRAPHIC SEGMENTS
Passenger, freight and other services revenue from domestic services within Australia is attributed to the Australian geographic region. Passenger, freight
and other services revenue from inbound and outbound services between Australia and overseas is allocated proportionately to the area in which the sale
was made. Other income is not allocated to a geographic region as it is impractical to do so.
Qantas Group
2009 2008
Analysis of total revenue by geographic region $M $M
Sales and other income
Passenger, freight and other services revenue
Australia 9,760 10,562
United Kingdom and Europe 1,102 1,152
Japan 384 490
South East Asia/North East Asia 668 616
The Americas and the Pacific 948 1,029
New Zealand 329 375
Other regions 358 318
13,549 14,542
Other income
Tours and travel 223 124
Contract work 426 454
Other unallocated 354 507
Sales and other income 14,552 15,627
Finance income 207 285
Total income 14,759 15,912
For the year ended 30 June 2009, the principal assets of the Qantas Group comprised the aircraft fleet, all except seven of which were registered and
domiciled in Australia. These assets are used flexibly across the Qantas Group’s worldwide route network. Accordingly, there is no suitable basis for
allocating such assets and the related liabilities between geographic areas.