Qantas 2009 Annual Report Download - page 109
Download and view the complete annual report
Please find page 109 of the 2009 Qantas annual report below. You can navigate through the pages in the report by either clicking on the pages listed below, or by using the keyword search tool below to find specific information within the annual report.-
 1
1 -
2
-
3
-
4
-
5
-
6
-
7
-
8
-
9
-
10
-
11
-
12
-
13
-
14
-
15
-
16
-
17
-
18
-
19
-
20
-
21
-
22
-
23
-
24
-
25
-
26
-
27
-
28
-
29
-
30
-
31
-
32
-
33
-
34
-
35
-
36
-
37
-
38
-
39
-
40
-
41
-
42
-
43
-
44
-
45
-
46
-
47
-
48
-
49
-
50
-
51
-
52
-
53
-
54
-
55
-
56
-
57
-
58
-
59
-
60
-
61
-
62
-
63
-
64
-
65
-
66
-
67
-
68
-
69
-
70
-
71
-
72
-
73
-
74
-
75
-
76
-
77
-
78
-
79
-
80
-
81
-
82
-
83
-
84
-
85
-
86
-
87
-
88
-
89
-
90
-
91
-
92
-
93
-
94
-
95
-
96
-
97
-
98
-
 99
99 -
 100
100 -
 101
101 -
 102
102 -
 103
103 -
 104
104 -
 105
105 -
 106
106 -
 107
107 -
 108
108 -
 109
109 -
 110
110 -
 111
111 -
 112
112 -
 113
113 -
 114
114 -
 115
115 -
 116
116 -
 117
117 -
 118
118 -
 119
119 -
120
-
121
-
122
-
123
-
124
-
125
-
126
-
127
-
128
-
129
-
130
-
131
-
132
-
133
-
134
-
135
-
136
-
137
-
138
-
139
-
140
-
141
-
142
-
143
-
144
-
145
-
146
-
147
-
148
-
149
-
150
-
151
-
152
-
153
-
154
-
155
-
156
-
157
-
158
-
159
-
160
-
161
-
162
-
163
-
164
 |
 |
107 Qantas Annual Report 2009
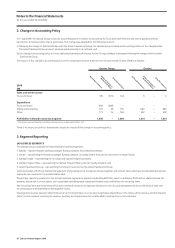
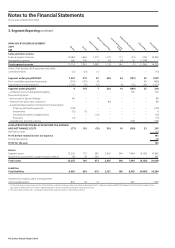
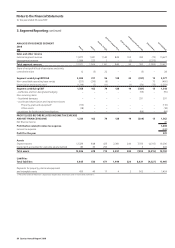
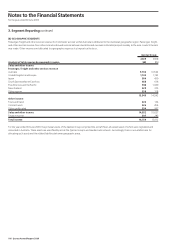
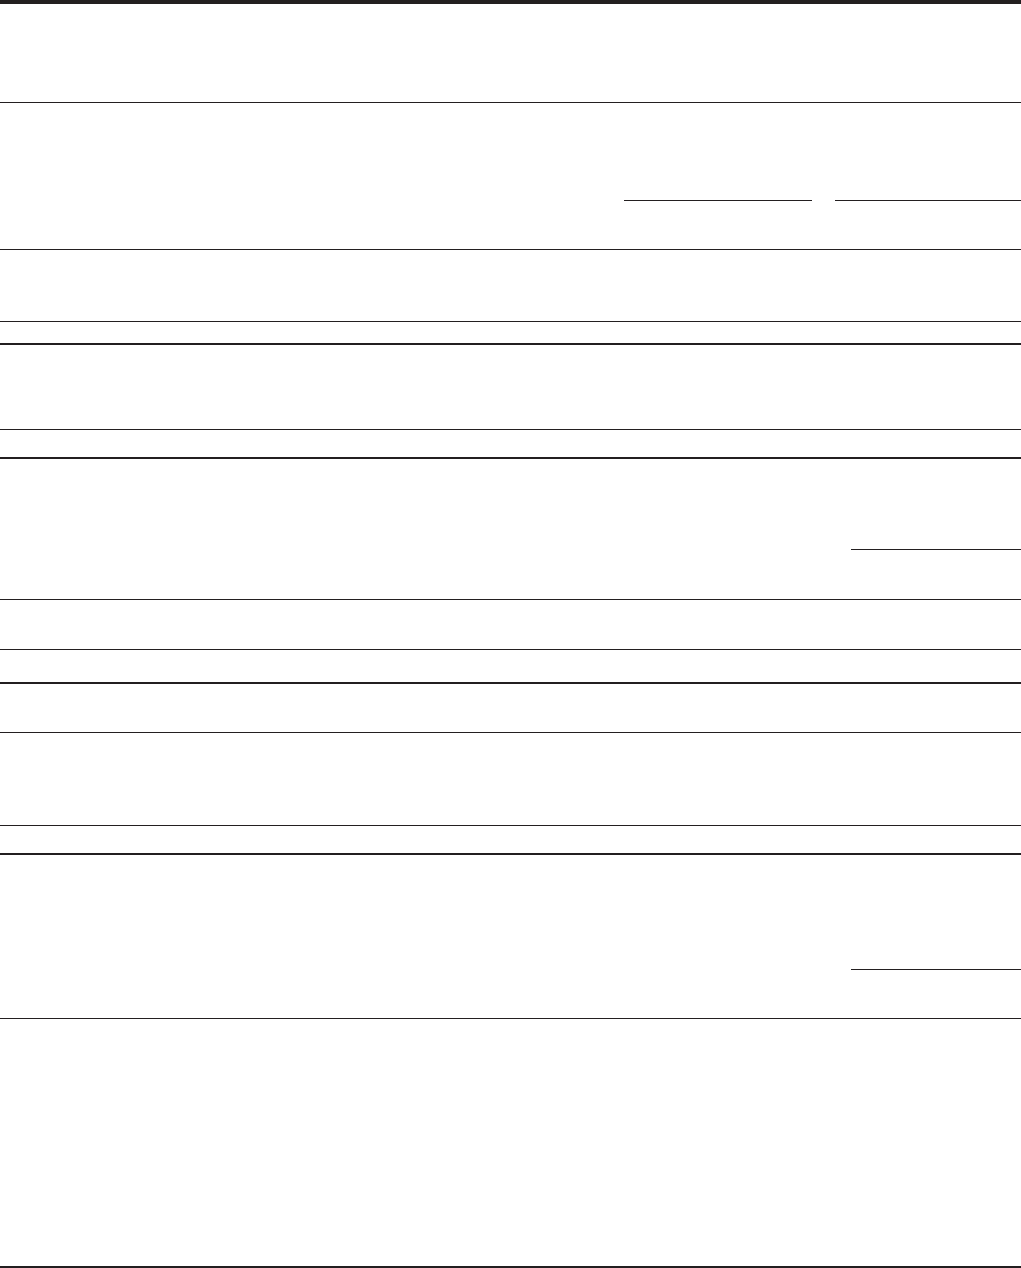
Notes to the Financial Statements
for the year ended 30 June 2009
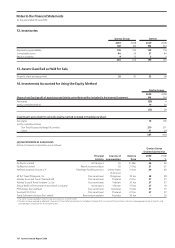
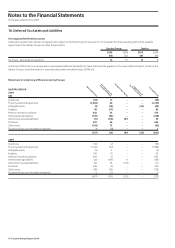
12. Inventories
Qantas Group Qantas
2009 2008 2009 2008
$M $M $M $M
Engineering expendables 195 150 159 116
Consumable stores 46 54 37 44
Work in progress 9 12 3 3
250 216 199 163
13. Assets Classified as Held for Sale
Property, plant and equipment 26 41 23 28
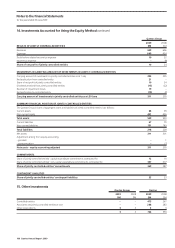
14. Investments Accounted for Using the Equity Method
Qantas Group
2009 2008
Share of net (loss)/profit of associates and jointly controlled entities included in the Income Statement: $M $M
Associates (25) 4
Jointly controlled entities 10 24
(15) 28
Investments accounted for using the equity method included in the Balance Sheet:
Associates 76 109
Jointly controlled entities
Star Track Express Holdings Pty Limited 270 271
Other 41 24
387 404
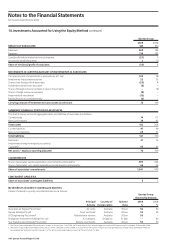
(A) INVESTMENTS IN ASSOCIATES
Details of interests in associates are as follows:
Qantas Group
Ownership Interest
Principal Country of Balance 2009 2008
Activity Incorporation Date % %
Air Pacific Limited Air transport Fiji 31 Mar 46 46
Fiji Resorts Limited Resort accommodation Fiji 31 Dec 21 21
Hallmark Aviation Services L.P. Passenger handling services United States 31 Dec 49 49
of America
HT & T Travel Philippines, Inc. Tours and travel Philippines 30 Jun 28 28
Holiday Tours and Travel (Thailand) Ltd Tours and travel Thailand 31 Dec 37 37
Holiday Tours & Travel Vietnam Co. Ltd Tours and travel Vietnam 30 Jun 37 37
Jetstar Pacific Airlines Aviation Joint Stock Company1 Air transport Vietnam 31 Dec 27 18
PT Holidays Tours & Travel Tours and travel Indonesia 31 Dec 37 37
Tour East (T.E.T) Ltd Tours and travel Thailand 31 Dec 37 37
Travel Software Solutions Pty Limited2 Reservations systems Australia 30 Jun – 50
1. The Qantas Group acquired a further nine per cent interest on 20 March 2009.
2. The Qantas Group acquired an additional 17 per cent of Travel Software Solutions Pty Limited on 8 October 2008. As a result of the transaction, the Qantas Group gained control of this entity and
ceased to equity account for this entity from this date.