Qantas 2009 Annual Report Download - page 111
Download and view the complete annual report
Please find page 111 of the 2009 Qantas annual report below. You can navigate through the pages in the report by either clicking on the pages listed below, or by using the keyword search tool below to find specific information within the annual report.-
 1
1 -
2
-
3
-
4
-
5
-
6
-
7
-
8
-
9
-
10
-
11
-
12
-
13
-
14
-
15
-
16
-
17
-
18
-
19
-
20
-
21
-
22
-
23
-
24
-
25
-
26
-
27
-
28
-
29
-
30
-
31
-
32
-
33
-
34
-
35
-
36
-
37
-
38
-
39
-
40
-
41
-
42
-
43
-
44
-
45
-
46
-
47
-
48
-
49
-
50
-
51
-
52
-
53
-
54
-
55
-
56
-
57
-
58
-
59
-
60
-
61
-
62
-
63
-
64
-
65
-
66
-
67
-
68
-
69
-
70
-
71
-
72
-
73
-
74
-
75
-
76
-
77
-
78
-
79
-
80
-
81
-
82
-
83
-
84
-
85
-
86
-
87
-
88
-
89
-
90
-
91
-
92
-
93
-
94
-
95
-
96
-
97
-
98
-
99
-
100
-
 101
101 -
 102
102 -
 103
103 -
 104
104 -
 105
105 -
 106
106 -
 107
107 -
 108
108 -
 109
109 -
 110
110 -
 111
111 -
 112
112 -
 113
113 -
 114
114 -
 115
115 -
 116
116 -
 117
117 -
 118
118 -
 119
119 -
 120
120 -
 121
121 -
122
-
123
-
124
-
125
-
126
-
127
-
128
-
129
-
130
-
131
-
132
-
133
-
134
-
135
-
136
-
137
-
138
-
139
-
140
-
141
-
142
-
143
-
144
-
145
-
146
-
147
-
148
-
149
-
150
-
151
-
152
-
153
-
154
-
155
-
156
-
157
-
158
-
159
-
160
-
161
-
162
-
163
-
164
 |
 |

109 Qantas Annual Report 2009
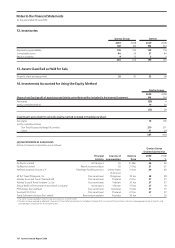
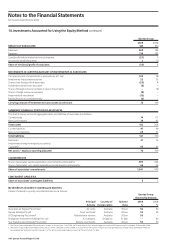
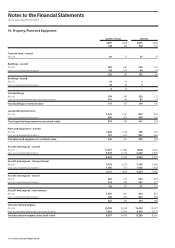
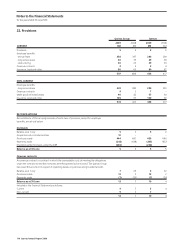
Notes to the Financial Statements
for the year ended 30 June 2009
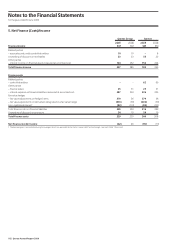
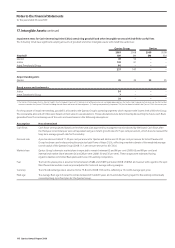
14. Investments Accounted for Using the Equity Method continued
Qantas Group
2009 2008
RESULTS OF JOINTLY CONTROLLED ENTITIES $M $M
Revenues 659 656
Expenses 649 624
Profit before related income tax expense 10 32
Income tax expense – (8)
Share of net profit of jointly controlled entities 10 24
MOVEMENTS IN CARRYING AMOUNT OF INVESTMENTS IN JOINTLY CONTROLLED ENTITIES
Carrying amount of investments in jointly controlled entities as at 1 July 295 295
Reclassification from controlled entity 21 –
Share of net profit of jointly controlled entities 10 24
Dividends received from jointly controlled entities (15) (22)
Reversal of impairment losses 19 –
Reclassification to controlled entity (19) (2)
Carrying amount of investments in jointly controlled entities as at 30 June 311 295
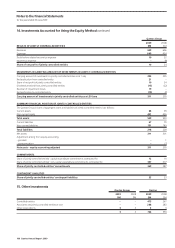
SUMMARY FINANCIAL POSITION OF JOINTLY CONTROLLED ENTITIES
The Qantas Group’s share of aggregate assets and liabilities of jointly controlled entities is as follows:
Current assets 88 93
Non-current assets 441 436
Total assets 529 529
Current liabilities 67 79
Non-current liabilities 151 149
Total liabilities 218 228
Net assets 311 301
Adjustment arising from equity accounting
- goodwill – 1
- superannuation – (7)
Net assets – equity accounting adjusted 311 295
COMMITMENTS
Share of jointly controlled entities’ capital expenditure commitments contracted for 12 10
Share of jointly controlled entities’ non-capital expenditure commitments contracted for 357 377
Share of jointly controlled entities’ commitments 369 387
CONTINGENT LIABILITIES
Share of jointly controlled entities’ contingent liabilities 33 33
15. Other Investments
Qantas Group Qantas
2009 2008 2009 2008
$M $M $M $M
Controlled entities – – 475 267
Associates and jointly controlled entities at cost – – 288 283
Other corporations 3 3 3 3
3 3 766 553