Qantas 2009 Annual Report Download - page 86
Download and view the complete annual report
Please find page 86 of the 2009 Qantas annual report below. You can navigate through the pages in the report by either clicking on the pages listed below, or by using the keyword search tool below to find specific information within the annual report.-
 1
1 -
2
-
3
-
4
-
5
-
6
-
7
-
8
-
9
-
10
-
11
-
12
-
13
-
14
-
15
-
16
-
17
-
18
-
19
-
20
-
21
-
22
-
23
-
24
-
25
-
26
-
27
-
28
-
29
-
30
-
31
-
32
-
33
-
34
-
35
-
36
-
37
-
38
-
39
-
40
-
41
-
42
-
43
-
44
-
45
-
46
-
47
-
48
-
49
-
50
-
51
-
52
-
53
-
54
-
55
-
56
-
57
-
58
-
59
-
60
-
61
-
62
-
63
-
64
-
65
-
66
-
67
-
68
-
69
-
70
-
71
-
72
-
73
-
74
-
75
-
 76
76 -
 77
77 -
 78
78 -
 79
79 -
 80
80 -
 81
81 -
 82
82 -
 83
83 -
 84
84 -
 85
85 -
 86
86 -
 87
87 -
 88
88 -
 89
89 -
 90
90 -
 91
91 -
 92
92 -
 93
93 -
 94
94 -
 95
95 -
 96
96 -
97
-
98
-
99
-
100
-
101
-
102
-
103
-
104
-
105
-
106
-
107
-
108
-
109
-
110
-
111
-
112
-
113
-
114
-
115
-
116
-
117
-
118
-
119
-
120
-
121
-
122
-
123
-
124
-
125
-
126
-
127
-
128
-
129
-
130
-
131
-
132
-
133
-
134
-
135
-
136
-
137
-
138
-
139
-
140
-
141
-
142
-
143
-
144
-
145
-
146
-
147
-
148
-
149
-
150
-
151
-
152
-
153
-
154
-
155
-
156
-
157
-
158
-
159
-
160
-
161
-
162
-
163
-
164
 |
 |

84 Qantas Annual Report 2009
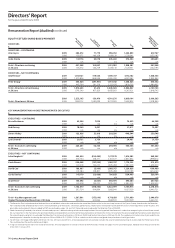
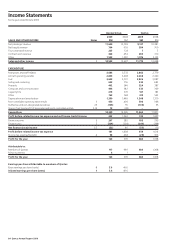
Income Statements
for the year ended 30 June 2009
Qantas Group Qantas
2009 2008 2009 2008
SALES AND OTHER INCOME Notes $M $M $M $M
Net passenger revenue 11,604 12,709 9,127 10,381
Net freight revenue 764 959 384 700
Tours and travel revenue 223 124 7 5
Contract work revenue 426 454 280 310
Other 1,535 1,381 1,976 2,102
Sales and other income 3 14,552 15,627 11,774 13,498
EXPENDITURE
Manpower and staff related 3,684 3,533 2,842 2,779
Aircraft operating variable 2,834 2,608 2,268 2,260
Fuel 3,602 3,701 2,836 3,087
Selling and marketing 632 755 532 683
Property 402 346 324 287
Computer and communication 406 382 333 309
Capacity hire 274 276 167 183
Other 765 768 419 552
Depreciation and amortisation 1,390 1,469 1,248 1,310
Non-cancellable operating lease rentals 3 450 400 396 366
Ineffective and non-designated derivatives 25 (105) 55 (105) 55
Share of net loss/(profit) of associates and jointly controlled entities 3,14 15 (28) – –
Expenditure 14,349 14,265 11,260 11,871
Profit before related income tax expense and net finance (costs)/income 203 1,362 514 1,627
Finance income 5 207 285 185 255
Finance costs 5 (229) (239) (240) (268)
Net finance (costs)/income 3,5 (22) 46 (55) (13)
Profit before related income tax expense 181 1,408 459 1,614
Income tax expense/(benefit) 6 58 438 (25) 306
Profit for the year 123 970 484 1,308
Attributable to:
Members of Qantas 117 969 484 1,308
Minority interest 6 1 – –
Profit for the year 123 970 484 1,308
Earnings per share attributable to members of Qantas:
Basic earnings per share (cents) 8 5.6 49.0
Diluted earnings per share (cents) 8 5.6 49.0