Qantas 2009 Annual Report Download - page 104
Download and view the complete annual report
Please find page 104 of the 2009 Qantas annual report below. You can navigate through the pages in the report by either clicking on the pages listed below, or by using the keyword search tool below to find specific information within the annual report.-
 1
1 -
2
-
3
-
4
-
5
-
6
-
7
-
8
-
9
-
10
-
11
-
12
-
13
-
14
-
15
-
16
-
17
-
18
-
19
-
20
-
21
-
22
-
23
-
24
-
25
-
26
-
27
-
28
-
29
-
30
-
31
-
32
-
33
-
34
-
35
-
36
-
37
-
38
-
39
-
40
-
41
-
42
-
43
-
44
-
45
-
46
-
47
-
48
-
49
-
50
-
51
-
52
-
53
-
54
-
55
-
56
-
57
-
58
-
59
-
60
-
61
-
62
-
63
-
64
-
65
-
66
-
67
-
68
-
69
-
70
-
71
-
72
-
73
-
74
-
75
-
76
-
77
-
78
-
79
-
80
-
81
-
82
-
83
-
84
-
85
-
86
-
87
-
88
-
89
-
90
-
91
-
92
-
93
-
 94
94 -
 95
95 -
 96
96 -
 97
97 -
 98
98 -
 99
99 -
 100
100 -
 101
101 -
 102
102 -
 103
103 -
 104
104 -
 105
105 -
 106
106 -
 107
107 -
 108
108 -
 109
109 -
 110
110 -
 111
111 -
 112
112 -
 113
113 -
 114
114 -
115
-
116
-
117
-
118
-
119
-
120
-
121
-
122
-
123
-
124
-
125
-
126
-
127
-
128
-
129
-
130
-
131
-
132
-
133
-
134
-
135
-
136
-
137
-
138
-
139
-
140
-
141
-
142
-
143
-
144
-
145
-
146
-
147
-
148
-
149
-
150
-
151
-
152
-
153
-
154
-
155
-
156
-
157
-
158
-
159
-
160
-
161
-
162
-
163
-
164
 |
 |

102 Qantas Annual Report 2009
Notes to the Financial Statements
for the year ended 30 June 2009
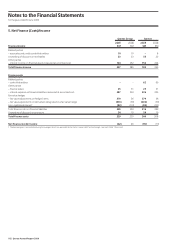
5. Net Finance (Costs)/Income
Qantas Group Qantas
2009 2008 2009 2008
Finance income $M $M $M $M
Related parties
– associates and jointly controlled entities 10 10 – 8
Unwinding of discount on receivables 33 23 33 23
Other parties
– interest income on financial assets measured at amortised cost 164 252 152 224
Total finance income 207 285 185 255
Finance costs
Related parties
– controlled entities – – 62 99
Other parties
– finance leases 25 31 25 31
– interest expense on financial liabilities measured at amortised cost 287 293 236 223
Fair value hedges
– fair value adjustments on hedged items 379 36 379 36
– fair value adjustments on derivatives designated in a fair value hedge (403) (39) (403) (39)
Less: capitalised interest1 (83) (101) (83) (101)
Total finance costs on financial liabilities 205 220 216 249
Unwinding of discount on provisions 24 19 24 19
Total finance costs 229 239 240 268
Net finance (costs)/income (22) 46 (55) (13)
1. The borrowing costs are capitalised using the average interest rate applicable to the Qantas Group’s debt facilities being 8.1 per cent (20 08: 7.9 per cent).