Qantas 2009 Annual Report Download - page 145
Download and view the complete annual report
Please find page 145 of the 2009 Qantas annual report below. You can navigate through the pages in the report by either clicking on the pages listed below, or by using the keyword search tool below to find specific information within the annual report.-
 1
1 -
2
-
3
-
4
-
5
-
6
-
7
-
8
-
9
-
10
-
11
-
12
-
13
-
14
-
15
-
16
-
17
-
18
-
19
-
20
-
21
-
22
-
23
-
24
-
25
-
26
-
27
-
28
-
29
-
30
-
31
-
32
-
33
-
34
-
35
-
36
-
37
-
38
-
39
-
40
-
41
-
42
-
43
-
44
-
45
-
46
-
47
-
48
-
49
-
50
-
51
-
52
-
53
-
54
-
55
-
56
-
57
-
58
-
59
-
60
-
61
-
62
-
63
-
64
-
65
-
66
-
67
-
68
-
69
-
70
-
71
-
72
-
73
-
74
-
75
-
76
-
77
-
78
-
79
-
80
-
81
-
82
-
83
-
84
-
85
-
86
-
87
-
88
-
89
-
90
-
91
-
92
-
93
-
94
-
95
-
96
-
97
-
98
-
99
-
100
-
101
-
102
-
103
-
104
-
105
-
106
-
107
-
108
-
109
-
110
-
111
-
112
-
113
-
114
-
115
-
116
-
117
-
118
-
119
-
120
-
121
-
122
-
123
-
124
-
125
-
126
-
127
-
128
-
129
-
130
-
131
-
132
-
133
-
134
-
 135
135 -
 136
136 -
 137
137 -
 138
138 -
 139
139 -
 140
140 -
 141
141 -
 142
142 -
 143
143 -
 144
144 -
 145
145 -
 146
146 -
 147
147 -
 148
148 -
 149
149 -
 150
150 -
 151
151 -
 152
152 -
 153
153 -
 154
154 -
 155
155 -
156
-
157
-
158
-
159
-
160
-
161
-
162
-
163
-
164
 |
 |

143 Qantas Annual Report 2009
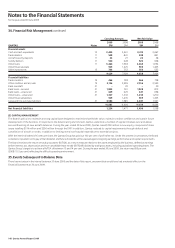
Notes to the Financial Statements
for the year ended 30 June 2009
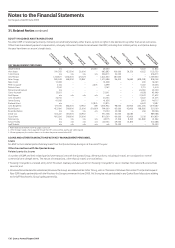
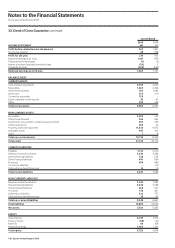
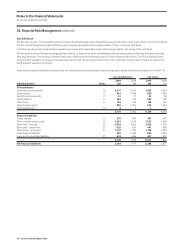
34. Financial Risk Management
Anancialinstrumentisanycontractthatgivesrisetobothanancialassetofoneentityandanancialliabilityorequityinstrumentofanotherentity.
TheQantasGroupissubjecttoliquidity,interestrate,foreignexchange,fuelpriceandcreditrisks.Theserisksareaninherentpartoftheoperationsofan
internationalairline.TheQantasGroupmanagestheseriskexposuresusingvariousnancialinstruments,usingasetofpoliciesapprovedbytheBoard.
Qantas Group policy is not to enter, issue or hold derivative financial instruments for speculative trading purposes.
TheQantasGroupusesdifferentmethodstoassessandmanagedifferenttypesofrisktowhichitisexposed.Thesemethodsincludesensitivityanalysisin
thecaseofinterestrate,foreignexchangeandotherpricerisks,andageinganalysisandsensitivityanalysisforliquidityriskandcreditrisk.
(A) LIQUIDITY RISK
Liquidityriskistheriskthatanentitywillencounterdifcultyinmeetingobligationsassociatedwithnancialliabilities.TheQantasGroupmanages
liquidityriskbytargetingaminimumliquiditylevel,ensuringlong-termcommitmentsaremanagedwithrespecttoforecastavailablecashinow,
maintainingaccesstoavarietyofadditionalfundingsourcesincludingcommercialpaperandstandbyfacilitiesandmanagingmaturityproles.
Thefollowingtablessummarisethecontractualtimingofcashows,includinginterestpayments,ofnancialliabilitiesandderivativeinstruments,
as at 30 June 2009 and 30 June 2008:
FINANCIAL LIABILITIES
QANTAS GROUP
2009
$M
Trade creditors 597 – – 597
Bankloans–secured1 424 1,769 1,115 3,308
Bankloans–unsecured1 23 641 – 664
Otherloans–unsecured1 78 818 685 1,581
Leaseandhirepurchaseliabilities1 164 344 175 683
Derivatives–inows (270) (1,782) (815) (2,867)
Derivatives–outows 819 2,065 886 3,770
Total financial liabilities 1,835 3,855 2,046 7,736
1.Recognisednancialliabilitycarryingvaluesareshownpre-hedging.
2008
Tradecreditors 670 – – 670
Bankloans–secured1 308 1,472 233 2,013
Bankloans–unsecured1 51 706 – 757
Otherloans–unsecured1 303 703 567 1,573
Leaseandhirepurchaseliabilities1 77 449 161 687
Derivatives–inows (553) (1,893) (665) (3,111)
Derivatives–outows 1,452 2,651 891 4,994
Total financial liabilities 2,308 4,088 1,187 7,583
1.Recognisednancialliabilitycarryingvaluesareshownpre-hedging.
1 to 5 Years
More than 5 Years
Total
Less than 1 Year