Qantas 2009 Annual Report Download - page 72
Download and view the complete annual report
Please find page 72 of the 2009 Qantas annual report below. You can navigate through the pages in the report by either clicking on the pages listed below, or by using the keyword search tool below to find specific information within the annual report.-
 1
1 -
2
-
3
-
4
-
5
-
6
-
7
-
8
-
9
-
10
-
11
-
12
-
13
-
14
-
15
-
16
-
17
-
18
-
19
-
20
-
21
-
22
-
23
-
24
-
25
-
26
-
27
-
28
-
29
-
30
-
31
-
32
-
33
-
34
-
35
-
36
-
37
-
38
-
39
-
40
-
41
-
42
-
43
-
44
-
45
-
46
-
47
-
48
-
49
-
50
-
51
-
52
-
53
-
54
-
55
-
56
-
57
-
58
-
59
-
60
-
61
-
 62
62 -
 63
63 -
 64
64 -
 65
65 -
 66
66 -
 67
67 -
 68
68 -
 69
69 -
 70
70 -
 71
71 -
 72
72 -
 73
73 -
 74
74 -
 75
75 -
 76
76 -
 77
77 -
 78
78 -
 79
79 -
 80
80 -
 81
81 -
 82
82 -
83
-
84
-
85
-
86
-
87
-
88
-
89
-
90
-
91
-
92
-
93
-
94
-
95
-
96
-
97
-
98
-
99
-
100
-
101
-
102
-
103
-
104
-
105
-
106
-
107
-
108
-
109
-
110
-
111
-
112
-
113
-
114
-
115
-
116
-
117
-
118
-
119
-
120
-
121
-
122
-
123
-
124
-
125
-
126
-
127
-
128
-
129
-
130
-
131
-
132
-
133
-
134
-
135
-
136
-
137
-
138
-
139
-
140
-
141
-
142
-
143
-
144
-
145
-
146
-
147
-
148
-
149
-
150
-
151
-
152
-
153
-
154
-
155
-
156
-
157
-
158
-
159
-
160
-
161
-
162
-
163
-
164
 |
 |
70 Qantas Annual Report 2009
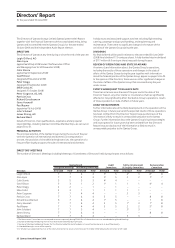
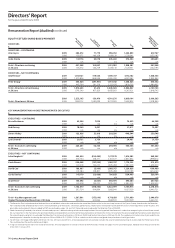
Directors’ Report
for the year ended 30 June 2009
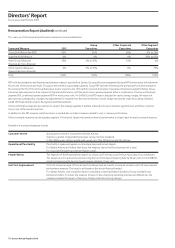
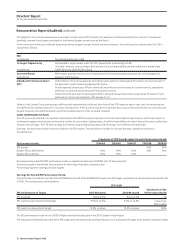
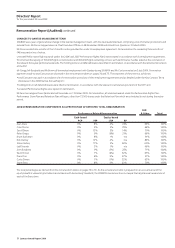
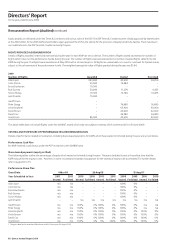
The make-up of the scorecard performance measures is summarised below:
Group Other Corporate Other Segment
Scorecard Measure CEO Executives Executives Executives
Group Profit Before Tax (PBT) 65% 65% 65% 0% to 35%
Segment Profit Measure 0% 0% 0% 30% to 65%
Other Group Measures 35% 0% to 35% 35% 0%
(financial and non-financial)
Other Segment Measures 0% 0% to 35% 0% 35%
(financial and non-financial)
Total 100% 100% 100% 100%
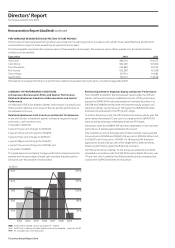
PBT is the key budgetary and financial performance measure used both at Qantas Group and business segment level and PBT performance will determine
65 per cent of the scorecard result. To support the overall Group strategic agenda, Group PBT has been selected as the primary performance measure in
the scorecard for the CEO, all Group Executives (senior reports to the CEO) and all corporate Executives. Executives in business segments (below Group
Executive) have exposure to their segment’s financial performance, with the performance assessed against either a combination of Group and business
segment PBT, or entirely business segment PBT for more junior roles. For 2009/10, the PBT target is adjusted for restructuring charges, the impact of
approved accounting policy changes and adjustments for volatility from the mark-to-market of open hedge instruments under Accounting Standard
AASB 139 Financial Instruments: Recognition and Measurement.
Other performance measures are selected to support the strategic agenda of Qantas, either at a Group or business segment level, and these comprise
35 per cent of the overall scorecard.
In addition to the PBT measure, each Executive’s scorecard also includes a measure related to cost or revenue performance.
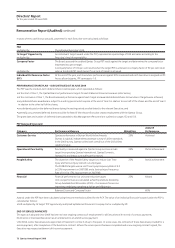
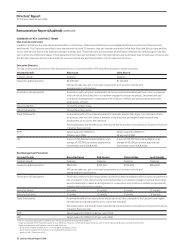
Other scorecard measures vary by business segment. A threshold, target and maximum level of performance is set each year for each scorecard measure.
Examples of scorecard measures include:
Customer Service Qantas performance in Skytrax World Airline Awards.
Skytrax is a global, independent passenger survey of airline standards.
In the 2009 survey, Qantas ranked sixth overall out of the 203 airlines rated by Skytrax.
Operational/Punctuality Punctuality is measured against on-time departures and arrivals targets.
For Qantas Airlines and Jetstar Executives, the measure relevant to their business unit is used.
For corporate Executives a combined figure is used.
People/Safety The objective of the People/Safety target is to reduce Lost Time Injury and Serious Injury rates of our employees.
The targets at a Group level involve improving the Lost Time Injury Frequency Rate by 24 per cent on the 2008/09
result and improving the Serious Injury Frequency Rate by 19 per cent.
Unit Cost Improvement Unit cost remains an area of focus across the business and, as a result, scorecards include a unit cost improvement
performance measure. The target is set based on the annual financial budget.
For Qantas Airlines, unit cost performance is calculated as Net Expenditure divided by Group Available Seat
Kilometres (ASKs). To ensure the measure focuses on the underlying operating activities and efficiencies, the
measure excludes the impact of fuel price changes and restructuring charges.
Remuneration Report (Audited) continued