Qantas 2009 Annual Report Download - page 106
Download and view the complete annual report
Please find page 106 of the 2009 Qantas annual report below. You can navigate through the pages in the report by either clicking on the pages listed below, or by using the keyword search tool below to find specific information within the annual report.-
 1
1 -
2
-
3
-
4
-
5
-
6
-
7
-
8
-
9
-
10
-
11
-
12
-
13
-
14
-
15
-
16
-
17
-
18
-
19
-
20
-
21
-
22
-
23
-
24
-
25
-
26
-
27
-
28
-
29
-
30
-
31
-
32
-
33
-
34
-
35
-
36
-
37
-
38
-
39
-
40
-
41
-
42
-
43
-
44
-
45
-
46
-
47
-
48
-
49
-
50
-
51
-
52
-
53
-
54
-
55
-
56
-
57
-
58
-
59
-
60
-
61
-
62
-
63
-
64
-
65
-
66
-
67
-
68
-
69
-
70
-
71
-
72
-
73
-
74
-
75
-
76
-
77
-
78
-
79
-
80
-
81
-
82
-
83
-
84
-
85
-
86
-
87
-
88
-
89
-
90
-
91
-
92
-
93
-
94
-
95
-
 96
96 -
 97
97 -
 98
98 -
 99
99 -
 100
100 -
 101
101 -
 102
102 -
 103
103 -
 104
104 -
 105
105 -
 106
106 -
 107
107 -
 108
108 -
 109
109 -
 110
110 -
 111
111 -
 112
112 -
 113
113 -
 114
114 -
 115
115 -
 116
116 -
117
-
118
-
119
-
120
-
121
-
122
-
123
-
124
-
125
-
126
-
127
-
128
-
129
-
130
-
131
-
132
-
133
-
134
-
135
-
136
-
137
-
138
-
139
-
140
-
141
-
142
-
143
-
144
-
145
-
146
-
147
-
148
-
149
-
150
-
151
-
152
-
153
-
154
-
155
-
156
-
157
-
158
-
159
-
160
-
161
-
162
-
163
-
164
 |
 |
104 Qantas Annual Report 2009
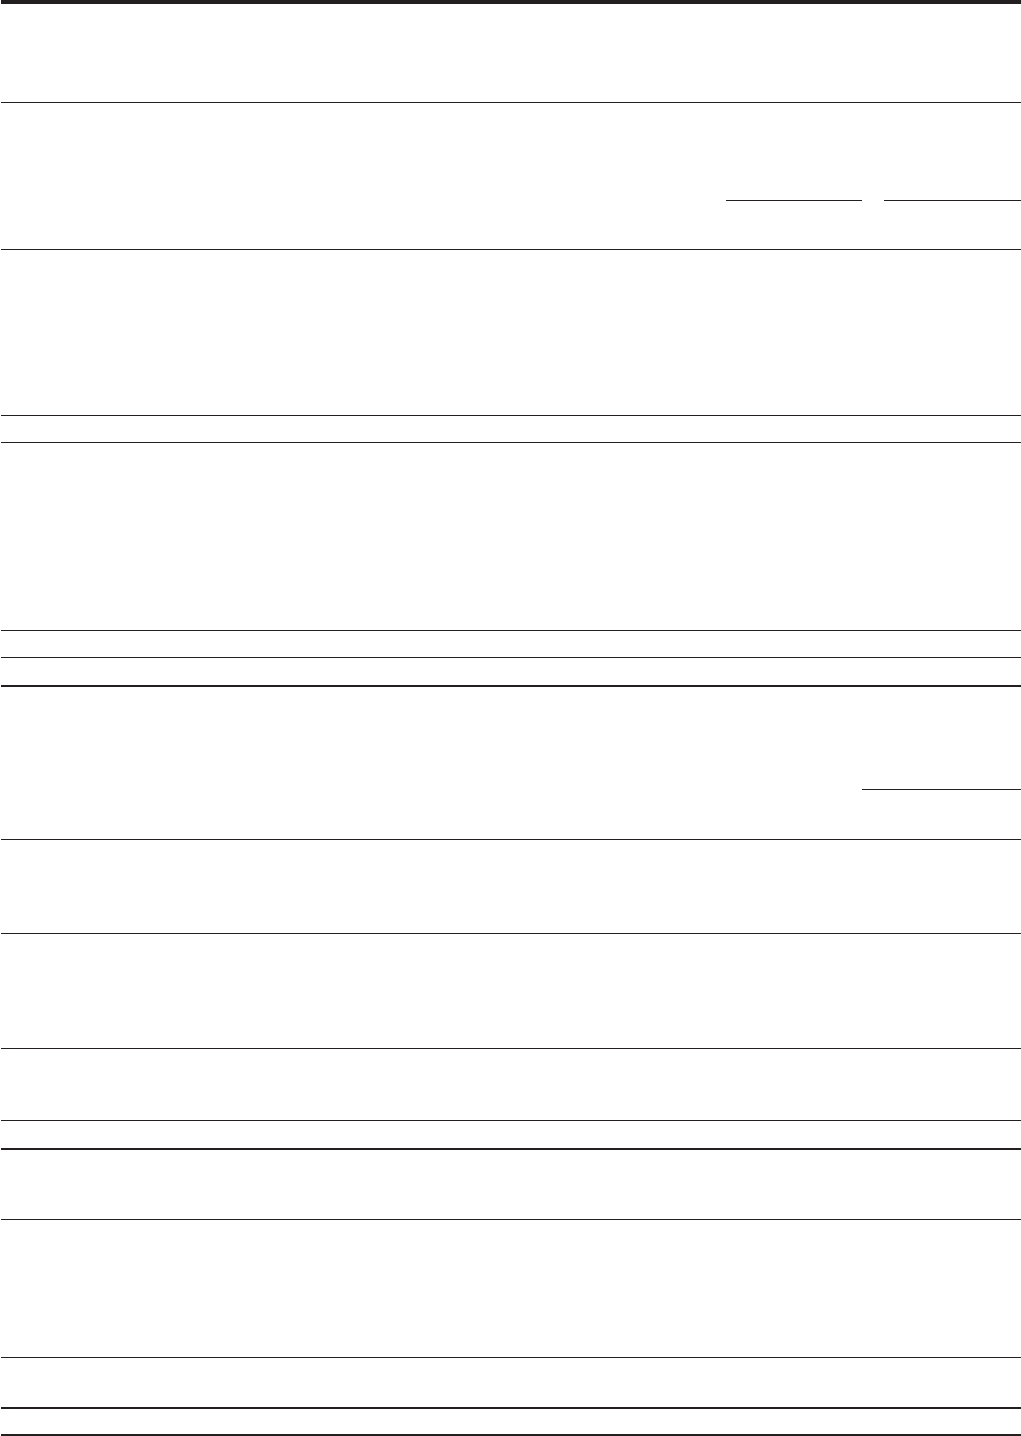
Notes to the Financial Statements
for the year ended 30 June 2009
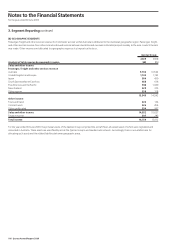
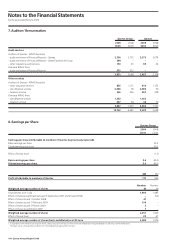
7. Auditors’ Remuneration
Qantas Group Qantas
2009 2008 2009 2008
$000 $000 $000 $000
Audit services
Auditors of Qantas – KPMG Australia
– audit and review of Financial Reports – Qantas 2,756 2,772 2,372 2,074
– audit and review of Financial Reports – Jetset Travelworld Group 594 – – –
– other regulatory audit services 153 49 85 34
Overseas KPMG firms
– audit and review of Financial Reports 332 227 – –
3,835 3,048 2,457 2,108
Other services
Auditors of Qantas – KPMG Australia
– other assurance services 855 1,171 810 1,152
– due diligence services 4,086 78 4,086 50
– taxation services 326 296 281 298
Overseas KPMG firms
– due diligence services 1,363 – 1,363 –
– taxation services 257 94 42 30
6,887 1,639 6,582 1,530
10,722 4,687 9,039 3,638
8. Earnings per Share
Qantas Group
2009 2008
Cents Cents
Earnings per share attributable to members of Qantas (as previously reported)
Basic earnings per share 50.2
Diluted earnings per share 50.2
Effect of bonus issue1 (1.2)
Basic earnings per share 5.6 49.0
Diluted earnings per share 5.6 49.0
$M $M
Profit attributable to members of Qantas 117 969
Number Number
Weighted average number of shares M M
Issued shares as at 1 July 1,894 1,985
Effect of shares bought back between 6 September 2007 and 23 April 2008 – (56)
Effect of shares issued 1 October 2008 41 –
Effect of shares issued 11 February 2009 104 –
Effect of shares issued 17 March 2009 5 –
Effect of shares issued 8 April 2009 7 –
Weighted average number of shares 2,051 1,929
Effect of bonus issue1 29 47
Weighted average number of shares (basic and diluted) as at 30 June 2,080 1,976
1. In accordance with AASB133 Earnings per Share, a bonus issue of shares occurs when shares are offered to existing shareholders at a discount to the market price.
This gives rise to a retrospective restatement of the weighted average number of shares.