Qantas 2009 Annual Report Download - page 62
Download and view the complete annual report
Please find page 62 of the 2009 Qantas annual report below. You can navigate through the pages in the report by either clicking on the pages listed below, or by using the keyword search tool below to find specific information within the annual report.-
 1
1 -
2
-
3
-
4
-
5
-
6
-
7
-
8
-
9
-
10
-
11
-
12
-
13
-
14
-
15
-
16
-
17
-
18
-
19
-
20
-
21
-
22
-
23
-
24
-
25
-
26
-
27
-
28
-
29
-
30
-
31
-
32
-
33
-
34
-
35
-
36
-
37
-
38
-
39
-
40
-
41
-
42
-
43
-
44
-
45
-
46
-
47
-
48
-
49
-
50
-
51
-
 52
52 -
 53
53 -
 54
54 -
 55
55 -
 56
56 -
 57
57 -
 58
58 -
 59
59 -
 60
60 -
 61
61 -
 62
62 -
 63
63 -
 64
64 -
 65
65 -
 66
66 -
 67
67 -
 68
68 -
 69
69 -
 70
70 -
 71
71 -
 72
72 -
73
-
74
-
75
-
76
-
77
-
78
-
79
-
80
-
81
-
82
-
83
-
84
-
85
-
86
-
87
-
88
-
89
-
90
-
91
-
92
-
93
-
94
-
95
-
96
-
97
-
98
-
99
-
100
-
101
-
102
-
103
-
104
-
105
-
106
-
107
-
108
-
109
-
110
-
111
-
112
-
113
-
114
-
115
-
116
-
117
-
118
-
119
-
120
-
121
-
122
-
123
-
124
-
125
-
126
-
127
-
128
-
129
-
130
-
131
-
132
-
133
-
134
-
135
-
136
-
137
-
138
-
139
-
140
-
141
-
142
-
143
-
144
-
145
-
146
-
147
-
148
-
149
-
150
-
151
-
152
-
153
-
154
-
155
-
156
-
157
-
158
-
159
-
160
-
161
-
162
-
163
-
164
 |
 |

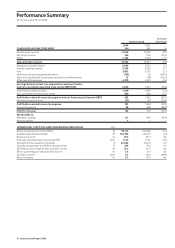
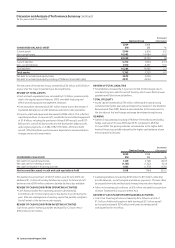
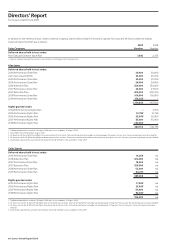
60 Qantas Annual Report 2009
Discussion and Analysis of Performance Summary (by Segment)
for the year ended 30 June 2009
Increase/
2009 2008 (Decrease)
QANTAS $M $M %
Revenue 11,710 12,971 (9.7)
Underlying EBIT 4 1,358 (99.7)
EBIT (77) 1,230 (106.3)
Total assets 12,263 12,406 (1.2)
•TheUnderlyingEBITforQantasAirlinestotalled$4million,adecrease
of $1,354 million.
•Netsignificantnon-recurringexpensesof$81millionreducedthe
reported EBIT to a loss of $77 million. Aircraft and investment write
downs were partially offset by the profit on sale of Qantas Holidays.
•Netpassengerrevenuedecreasedby9.2percentreflectingadecreasein
seat factor to 80.1 per cent and yield declines as a result of the global
economic downturn and reduction in passenger demand. Capacity
decreased in the international market as a result of shifting some services
to Jetstar and reduced flying. Domestically, QantasLink thrived on the
introduction of more Bombardier Q400 aircraft.
•Fuelcontinuedtobethelargestcostforthesegmentwithpriceincreases
offset by capacity reductions and fuel conservation measures.
•Manpowerandaircraftoperatingcostswerealsohigherthisyear
compared to last as a result of foreign exchange rates and price rises.
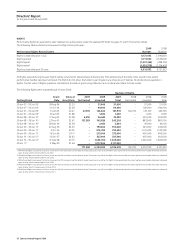
Increase/
2009 2008 (Decrease)
QANTAS FREQUENT FLYER $M $M %
Revenue 1,133 849 33.5
Underlying EBIT 226 128 76.6
EBIT 310 128 142.2
Total assets 2,616 2,381 9.9
•TheincreaseinUnderlyingEBITof$98millionforQantasFrequentFlyer
is a 76.6 cent increase on the prior year.
•ThegrowthofUnderlyingEBITby$98million,representstheincreased
popularity of the program (and membership) from recent enhancements
and alliances.
•EBITtotalled$310million,whichincludesa$147millionbenefitfrom
the change in accounting for frequent flyer revenue. Of this benefit,
$84 million is non-recurring.
Increase/
2009 2008 (Decrease)
JETSET TRAVELWORLD GROUP $M $M %
Revenue 145 99 46.5
Underlying EBIT 16 19 (15.8)
EBIT 16 19 (15.8)
Total assets 364 240 51.7
•JetsetTravelworldGroupbecamepartoftheconsolidatedgroup
on 25 July 2008. The prior year comparatives represent the Qantas
Holidays business only.
Increase/
2009 2008 (Decrease)
JETSTAR $M $M %
Revenue 1,851 1,564 18.4
Underlying EBIT 107 102 4.9
EBIT 126 102 23.5
Total assets 796 678 17. 4
•JetstarrecordedanUnderlyingEBITof$107million,anincreaseof
$5 million.
•ReportedEBITincreasedto$126millionduetoa$19millionnon-recurring
write back of an impairment provision from a previous year upon the
change in ownership of Jetstar Asia.
•Passengerrevenueincreasedby17.6percent,largelydrivenbyexpansion
across both the domestic and international networks. Load factors and
yield improved across Jetstar contributing to the revenue improvement.
•Thegrowthofthenetworkincreasedcostsparticularlyinmanpower,
fuel and aircraft operating costs, however foreign exchange rates also
adversely affected costs.
•TheGroupincreasedits’percentageownershipinJetstarAsiawhichis
now consolidated in the Jetstar segment result.
•EquitylossesfromJetstarPacificincreasedfrom$3millionto$15million.
Increase/
2009 2008 (Decrease)
QANTAS FREIGHT $M $M %
Revenue 1,080 1,141 (5.3)
Underlying EBIT 7 79 (91.1)
EBIT (15) 79 (119.0)
Total assets 672 715 (6.0)
•TheFreightsegmentrecordedanUnderlyingEBITof$7million,adecrease
of $72 million.
•Anon-recurring$22millionimpairmentofgoodwillreducedEBITtoaloss
of $15 million.
•Theglobaleconomicdownturnandcapacitycutsacrossthenetwork
contributed to the 5.3 per cent decline in the segment revenue.
•Operatingcostsacrossthesegmentwereinlinewithreducedcapacity,
however foreign exchange fluctuations adversely affected costs.