Qantas 2009 Annual Report Download - page 149
Download and view the complete annual report
Please find page 149 of the 2009 Qantas annual report below. You can navigate through the pages in the report by either clicking on the pages listed below, or by using the keyword search tool below to find specific information within the annual report.-
 1
1 -
2
-
3
-
4
-
5
-
6
-
7
-
8
-
9
-
10
-
11
-
12
-
13
-
14
-
15
-
16
-
17
-
18
-
19
-
20
-
21
-
22
-
23
-
24
-
25
-
26
-
27
-
28
-
29
-
30
-
31
-
32
-
33
-
34
-
35
-
36
-
37
-
38
-
39
-
40
-
41
-
42
-
43
-
44
-
45
-
46
-
47
-
48
-
49
-
50
-
51
-
52
-
53
-
54
-
55
-
56
-
57
-
58
-
59
-
60
-
61
-
62
-
63
-
64
-
65
-
66
-
67
-
68
-
69
-
70
-
71
-
72
-
73
-
74
-
75
-
76
-
77
-
78
-
79
-
80
-
81
-
82
-
83
-
84
-
85
-
86
-
87
-
88
-
89
-
90
-
91
-
92
-
93
-
94
-
95
-
96
-
97
-
98
-
99
-
100
-
101
-
102
-
103
-
104
-
105
-
106
-
107
-
108
-
109
-
110
-
111
-
112
-
113
-
114
-
115
-
116
-
117
-
118
-
119
-
120
-
121
-
122
-
123
-
124
-
125
-
126
-
127
-
128
-
129
-
130
-
131
-
132
-
133
-
134
-
135
-
136
-
137
-
138
-
 139
139 -
 140
140 -
 141
141 -
 142
142 -
 143
143 -
 144
144 -
 145
145 -
 146
146 -
 147
147 -
 148
148 -
 149
149 -
 150
150 -
 151
151 -
 152
152 -
 153
153 -
 154
154 -
 155
155 -
 156
156 -
 157
157 -
 158
158 -
 159
159 -
160
-
161
-
162
-
163
-
164
 |
 |
147 Qantas Annual Report 2009
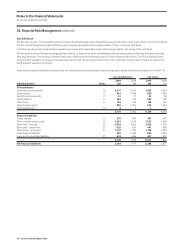
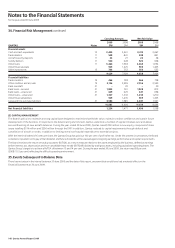
Notes to the Financial Statements
for the year ended 30 June 2009
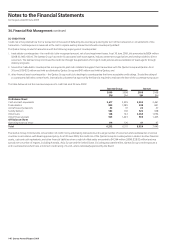
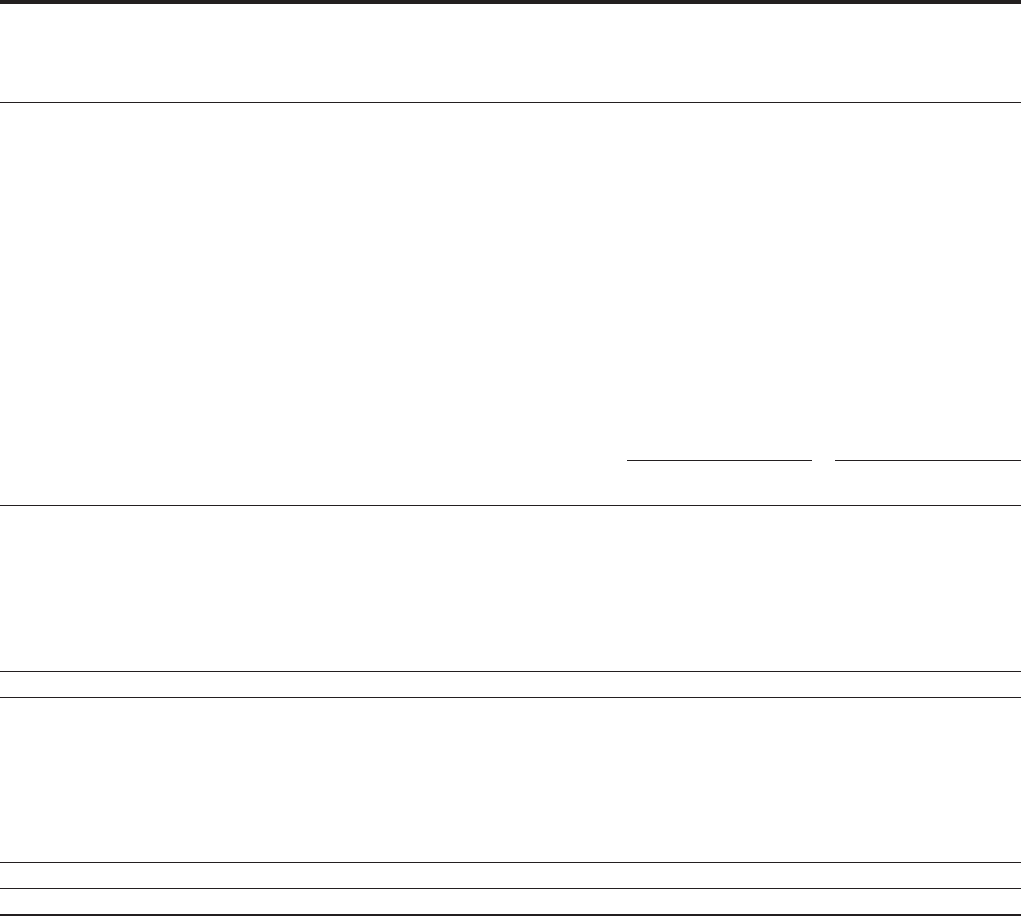
34. Financial Risk Management continued
Carrying Amount Fair Value
2009 2008 2009 2008
QANTAS GROUP Notes $M $M $M $M
Financial assets
Cash and cash equivalents 10 3,617 2,599 3,625 2,625
Tradedebtors 11 824 1,085 824 1,085
Aircraft security deposits 11 42 37 42 38
Sundrydebtors 11 582 702 582 702
Other loans 11 128 143 128 143
Other financial assets 905 1,423 905 1,423
Other investments 15 3 3 3 3
6,101 5,992 6,109 6,019
Financial liabilities
Trade creditors 19 597 670 597 670
Other creditors and accruals 19 1,236 1,504 1,236 1,504
Bankloans–secured 21 2,934 1,692 3,029 1,754
Bankloans–unsecured 21 629 629 641 658
Otherloans–unsecured 21 1,307 1,233 1,358 1,290
Othernancialliabilities 909 1,435 909 1,435
Leaseandhirepurchaseliabilities 21 633 606 637 579
8,245 7,769 8,407 7, 89 0
Net financial liabilities 2,14 4 1,777 2,298 1,871
(D) FAIR VALUE
Thefairvalueofcash,cashequivalentsandnon-interest-bearingnancialassetsandliabilitiesapproximatestheircarryingvalueduetotheirshortmaturity.
Thefairvalueofnancialassetsandliabilitiesisdeterminedbyvaluingthematthepresentvalueoffuturecontractedcashows.
Cashowsarediscountedusingstandardvaluationtechniquesattheapplicablemarketyield,havingregardtothetimingofthecashows.
Thefairvalueofforwardforeignexchangeandfuelcontractsisdeterminedastheunrealisedgain/lossatbalancedatebyreferencetomarketexchange
rates and fuel prices. The fair value of interest rate swaps is determined as the present value of future contracted cash flows. Cash flows are discounted
usingstandardvaluationtechniquesattheapplicablemarketyield,havingregardtothetimingofthecashows.Thefairvalueofoptionsisdetermined
using standard valuation techniques.
OthernancialassetsandliabilitiesrepresentthefairvalueofderivativenancialinstrumentsrecognisedonBalanceSheetinaccordancewithAASB139.