Qantas 2009 Annual Report Download - page 61
Download and view the complete annual report
Please find page 61 of the 2009 Qantas annual report below. You can navigate through the pages in the report by either clicking on the pages listed below, or by using the keyword search tool below to find specific information within the annual report.-
 1
1 -
2
-
3
-
4
-
5
-
6
-
7
-
8
-
9
-
10
-
11
-
12
-
13
-
14
-
15
-
16
-
17
-
18
-
19
-
20
-
21
-
22
-
23
-
24
-
25
-
26
-
27
-
28
-
29
-
30
-
31
-
32
-
33
-
34
-
35
-
36
-
37
-
38
-
39
-
40
-
41
-
42
-
43
-
44
-
45
-
46
-
47
-
48
-
49
-
50
-
 51
51 -
 52
52 -
 53
53 -
 54
54 -
 55
55 -
 56
56 -
 57
57 -
 58
58 -
 59
59 -
 60
60 -
 61
61 -
 62
62 -
 63
63 -
 64
64 -
 65
65 -
 66
66 -
 67
67 -
 68
68 -
 69
69 -
 70
70 -
 71
71 -
72
-
73
-
74
-
75
-
76
-
77
-
78
-
79
-
80
-
81
-
82
-
83
-
84
-
85
-
86
-
87
-
88
-
89
-
90
-
91
-
92
-
93
-
94
-
95
-
96
-
97
-
98
-
99
-
100
-
101
-
102
-
103
-
104
-
105
-
106
-
107
-
108
-
109
-
110
-
111
-
112
-
113
-
114
-
115
-
116
-
117
-
118
-
119
-
120
-
121
-
122
-
123
-
124
-
125
-
126
-
127
-
128
-
129
-
130
-
131
-
132
-
133
-
134
-
135
-
136
-
137
-
138
-
139
-
140
-
141
-
142
-
143
-
144
-
145
-
146
-
147
-
148
-
149
-
150
-
151
-
152
-
153
-
154
-
155
-
156
-
157
-
158
-
159
-
160
-
161
-
162
-
163
-
164
 |
 |
59 Qantas Annual Report 2009
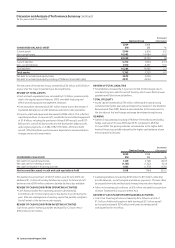
Discussion and Analysis of Performance Summary continued
for the year ended 30 June 2009
Increase/
Qantas Group (decrease)
2009 2008
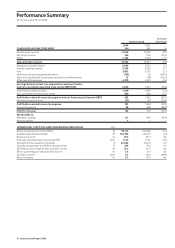
CONDENSED BALANCE SHEET $M $M %
Current assets 5,966 5,616 6.2
Non-current assets 14,083 14,084 <0.0
Total assets 20,049 19,700 1.8
Current liabilities 6,714 7, 604 (11.7)
Non-current liabilities 7,570 6,361 19.0
Total liabilities 14,284 13,965 2.3
Total equity 5,765 5,735 0.5
Net debt to net debt plus equity (ratio) 25:75 24:76
Net debt to net debt plus equity including off Balance Sheet debt (ratio) 49:51 46:54
Increase/
Qantas Group (decrease)
2009 2008
CONDENSED CASH FLOW $M $M %
Net cash from operating activities 1,129 2,128 (46.9)
Net cash used in investing activities (1,163) (1,322) (12.0)
Net cash from/(used) in financing activities 1,052 (1,570) 167.0
Net increase/(decrease) in cash and cash equivalents held 1,018 (764) 233.2
The net assets of the Qantas Group increased by $30 million to $5.8 billion
at year end. The major movements are discussed below.
REVIEW OF TOTAL ASSETS
•Cashandcashequivalentshaveincreasedby$1.0billion,predominantly
due to the capital raised in February 2009, new debt financing and
effective working capital management initiatives.
•Totalreceivablesdecreasedby$391millionmainlyduetothereceiptof
liquidated damages on aircraft deliveries and lower trade receivables.
•Property,plantandequipmentdecreasedby$186million.Thisreflected
capital expenditure on new aircraft, modifications and related equipment
of $1.4 billion, including the purchase of three A380 aircraft, one B737-
800 aircraft, one A330-200 aircraft and five Bombardier Q400 aircraft,
and progress payments on A380, B787, B737-800, A330 and A320
aircraft. Offsetting these purchases were depreciation and amortisation
charges and aircraft impairments.
REVIEW OF TOTAL LIABILITIES
•Totalliabilitiesincreasedby2.3percentto$14.3billionlargelydueto
increased long term debt for aircraft funding which was offset by lower
payables and Other financial liabilities.
TOTAL OF EQUITY
•Issuedcapitalincreasedby$753millionreflectingthecapitalraising
completed during the year and participation by investors in the Dividend
Reinvestment Plan (DRP). Reserves decreased due to the movements in
the fair value of fuel and foreign exchange derivatives during the year.
GEARING
•QantasGroupgearing(includingoffBalanceSheetdebtbutexcluding
hedge reserves) at 30 June 2009 was 49:51 compared to 46:54 at
30 June 2008. The gearing ratio has increased due to the higher debt
levels of the group partially reduced by the higher cash balances at year
end compared to last year.
The Qantas Group held cash of $3,617 million as at 30 June 2009. An
additional $1.1 billion of funding facilities are in place for future aircraft
deliveries and a $500 million undrawn standby facility is also available.
REVIEW OF CASH FLOWS FROM OPERATING ACTIVITIES
•Cashflowsprovidedfromoperatingactivitiesdecreasedby
$1.0 billion to $1.1 billion mainly due to the decline in profit during the
year. Effective management of working capital has partially mitigated
the full extent of the decline in cash receipts.
REVIEW OF CASH FLOWS FROM INVESTING ACTIVITIES
Cash flows used in investing activities decreased by 12.0 per cent or
$159 million to $1.2 billion.
•Capitalexpenditureincreasedby$106millionto$1.5billion,reflecting
aircraft deliveries, aircraft progress and delivery payments. This was offset
by proceeds from sale and lease back transactions and other disposals.
•Othernetinvestingcashoutflowsof$13millionincludedtheacquisition
of Jetset Travelworld Group and Jetstar Asia.
REVIEW OF CASH FLOWS FROM FINANCING AC TIVITIES
•Cashfromfinancingactivitiesincreasedby$2.6billiontoatotalof
$1.1 billion. Additional long-term debt funding of $1.5 billion as well
as the capital raising of $514 million and lower dividends paid all
contributed to the net inflow.