Qantas 2009 Annual Report Download - page 73
Download and view the complete annual report
Please find page 73 of the 2009 Qantas annual report below. You can navigate through the pages in the report by either clicking on the pages listed below, or by using the keyword search tool below to find specific information within the annual report.-
 1
1 -
2
-
3
-
4
-
5
-
6
-
7
-
8
-
9
-
10
-
11
-
12
-
13
-
14
-
15
-
16
-
17
-
18
-
19
-
20
-
21
-
22
-
23
-
24
-
25
-
26
-
27
-
28
-
29
-
30
-
31
-
32
-
33
-
34
-
35
-
36
-
37
-
38
-
39
-
40
-
41
-
42
-
43
-
44
-
45
-
46
-
47
-
48
-
49
-
50
-
51
-
52
-
53
-
54
-
55
-
56
-
57
-
58
-
59
-
60
-
61
-
62
-
 63
63 -
 64
64 -
 65
65 -
 66
66 -
 67
67 -
 68
68 -
 69
69 -
 70
70 -
 71
71 -
 72
72 -
 73
73 -
 74
74 -
 75
75 -
 76
76 -
 77
77 -
 78
78 -
 79
79 -
 80
80 -
 81
81 -
 82
82 -
 83
83 -
84
-
85
-
86
-
87
-
88
-
89
-
90
-
91
-
92
-
93
-
94
-
95
-
96
-
97
-
98
-
99
-
100
-
101
-
102
-
103
-
104
-
105
-
106
-
107
-
108
-
109
-
110
-
111
-
112
-
113
-
114
-
115
-
116
-
117
-
118
-
119
-
120
-
121
-
122
-
123
-
124
-
125
-
126
-
127
-
128
-
129
-
130
-
131
-
132
-
133
-
134
-
135
-
136
-
137
-
138
-
139
-
140
-
141
-
142
-
143
-
144
-
145
-
146
-
147
-
148
-
149
-
150
-
151
-
152
-
153
-
154
-
155
-
156
-
157
-
158
-
159
-
160
-
161
-
162
-
163
-
164
 |
 |
71 Qantas Annual Report 2009
Directors’ Report
for the year ended 30 June 2009
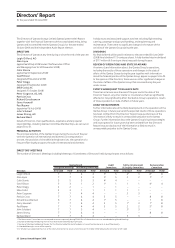
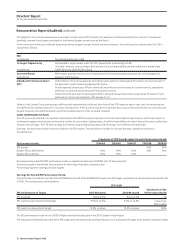
The targets for all scorecard measures are set annually. Specific annual PBT and unit cost targets are not disclosed publicly for reasons of commercial
sensitivity, however these targets are based on the financial budget set each year by the Board.
At the conclusion of the year, the Board assesses performance against target for each scorecard measure. For each Executive, reward under the STIP is
calculated as follows:
FAR
multiplied by The individual Executive’s FAR.
‘at target’ Opportunity An individual’s target reward under the STIP, expressed as a percentage of FAR.
‘At target’ reward is set according to the Executive’s level of responsibility and with reference to market data
multipliedby (S&P/ASX50andS&P/ASX200Indices).
Scorecard Result Performance against the scorecard of financial and non-financial measures (expressed as a percentage) that
multiplied by applies to that Executive.
Individual Performance Factor Differentiation of incentive payments among Executives based on individual performance is an important part of
(IPF) the approach to performance management at Qantas.
At the beginning of each year, KPIs for individual Executives are set in the areas of customer service, operational
performance, people achievements and financial performance.
At the end of the year, performance against KPIs is assessed and each Executive is assigned an IPF based on their
performance. Across all participants, IPFs average to 1.0.
Subject to the Qantas Group achieving a profit threshold determined by the Board, two thirds of the STIP reward is paid in cash, with the remaining one
third deferred into Qantas shares with a two year vesting period. If the Qantas Group does not achieve the Group profit threshold then no cash bonus will
be paid, however some deferred award may still be possible based on other scorecard measures.
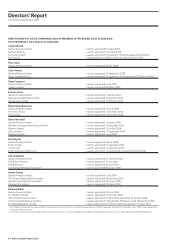
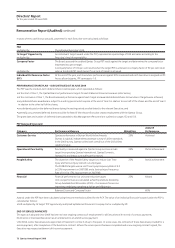
LONG TERM INCENTIVE PLAN
The LTIP (previously referred to as the Performance Rights Plan (PRP)) involves annual grants of Performance Rights to participants, which may, subject to
achievement against the three year performance hurdles, be converted to Qantas shares. Any Performance Rights for which the performance hurdles have
not been met will lapse. The LTIP seeks to align the interests of participating Executives with the longer term interests of shareholders.
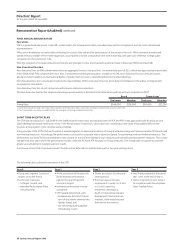
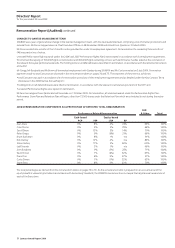
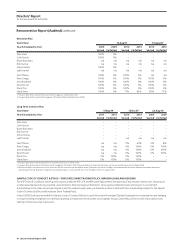
Each year, the Board sets the performance hurdles for the LTIP awards. The performance hurdles for the past five years’ awards are outlined in
the table below:
Proportion of LTIP Awards subject to each Performance Hurdle
Performance Hurdle 2004/05 2005/06 2006/07 2007/08 2008/09
EPS growth 50% 50%
RelativeTSRvsS&P/ASX100 50% 50% 50% 50% 50%
Relative TSR vs Airlines 50% 50% 50%
By implementing a dual TSR/EPS performance hurdle, as Qantas has done since 2007/08, the LTIP links reward to:
•achievingsuperiorshareholderreturnsrelativetoothermajorAustraliancompanies;and
•achievinglong-termearningspersharetargets.
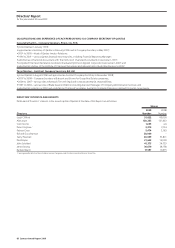
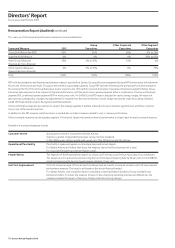
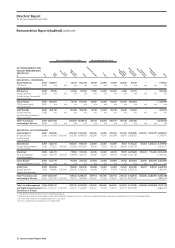
Earnings Per Share (EPS) Performance Hurdle
The performance hurdle for one half of the 2007/08 and one half of the 2008/09 LTIP award is an EPS target, expressed as a compound annual growth rate
(CAGR). The vesting scale is outlined below:
EPS CAGR
Satisfaction of the
EPS Performance vs Target 2007/08 Award 2008/09 Award Performance Hurdle
EPS threshold Below 9.5% Below 6.0% Nil
EPS result between threshold and target 9.5% to 12.4% 6.0% to 12.4% Linear scale:
50% to 99%
EPS result at or above stretch target 12.5% or above 12.5% or above 100%
The EPS performance hurdle for the 2009/10 Rights award will be disclosed in the 2010 Qantas Annual Report.
The setting by the Qantas Board of the above EPS targets does not represent an earnings forecast nor is it a disclosure of targets under Qantas’ long-term budget.
Remuneration Report (Audited) continued