Qantas 2009 Annual Report Download - page 112
Download and view the complete annual report
Please find page 112 of the 2009 Qantas annual report below. You can navigate through the pages in the report by either clicking on the pages listed below, or by using the keyword search tool below to find specific information within the annual report.-
 1
1 -
2
-
3
-
4
-
5
-
6
-
7
-
8
-
9
-
10
-
11
-
12
-
13
-
14
-
15
-
16
-
17
-
18
-
19
-
20
-
21
-
22
-
23
-
24
-
25
-
26
-
27
-
28
-
29
-
30
-
31
-
32
-
33
-
34
-
35
-
36
-
37
-
38
-
39
-
40
-
41
-
42
-
43
-
44
-
45
-
46
-
47
-
48
-
49
-
50
-
51
-
52
-
53
-
54
-
55
-
56
-
57
-
58
-
59
-
60
-
61
-
62
-
63
-
64
-
65
-
66
-
67
-
68
-
69
-
70
-
71
-
72
-
73
-
74
-
75
-
76
-
77
-
78
-
79
-
80
-
81
-
82
-
83
-
84
-
85
-
86
-
87
-
88
-
89
-
90
-
91
-
92
-
93
-
94
-
95
-
96
-
97
-
98
-
99
-
100
-
101
-
 102
102 -
 103
103 -
 104
104 -
 105
105 -
 106
106 -
 107
107 -
 108
108 -
 109
109 -
 110
110 -
 111
111 -
 112
112 -
 113
113 -
 114
114 -
 115
115 -
 116
116 -
 117
117 -
 118
118 -
 119
119 -
 120
120 -
 121
121 -
 122
122 -
123
-
124
-
125
-
126
-
127
-
128
-
129
-
130
-
131
-
132
-
133
-
134
-
135
-
136
-
137
-
138
-
139
-
140
-
141
-
142
-
143
-
144
-
145
-
146
-
147
-
148
-
149
-
150
-
151
-
152
-
153
-
154
-
155
-
156
-
157
-
158
-
159
-
160
-
161
-
162
-
163
-
164
 |
 |
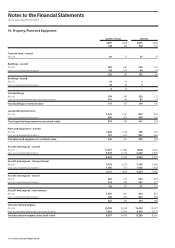
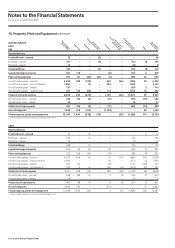
110 Qantas Annual Report 2009
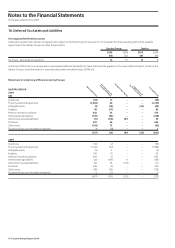
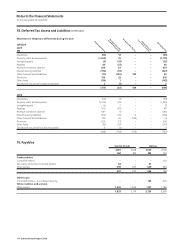
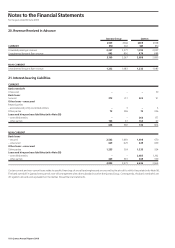
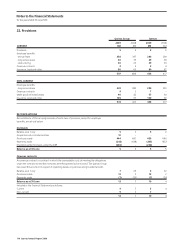
Notes to the Financial Statements
for the year ended 30 June 2009
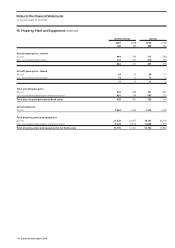
16. Property, Plant and Equipment
Qantas Group Qantas
2009 2008 2009 2008
$M $M $M $M
Freehold land – owned
At cost 66 72 47 47
Buildings – owned
At cost 283 281 223 223
Less: accumulated depreciation 118 100 84 74
165 181 139 149
Buildings – leased
At cost 51 59 3 –
Less: accumulated amortisation 43 47 3 –
8 12 – –
Total buildings
At cost 334 340 226 223
Less: accumulated depreciation and amortisation 161 147 87 74
Total buildings at net book value 173 193 139 149
Leasehold improvements
At cost 1,479 1,361 905 810
Less: accumulated amortisation 900 820 488 432
Total leasehold improvements at net book value 579 541 417 378
Plant and equipment – owned
At cost 1,264 1,230 788 796
Less: accumulated depreciation 721 679 495 466
Total plant and equipment at net book value 543 551 293 330
Aircraft and engines – owned
At cost 11,297 11,0 86 7,878 7, 833
Less: accumulated depreciation 4,974 4,796 4,225 3,876
6,323 6,290 3,653 3,957
Aircraft and engines – hire purchased
At cost 3,192 2,575 5,758 5,086
Less: accumulated amortisation 1,055 721 1,538 1,418
2,137 1,854 4,220 3,668
Aircraft and engines – leased
At cost 622 616 604 604
Less: accumulated amortisation 512 479 507 477
110 137 97 127
Aircraft and engines – maintenance
At cost 1,087 891 964 804
Less: accumulated depreciation 720 564 645 506
367 327 319 298
Total aircraft and engines
At cost 16,198 15,168 15,204 14,327
Less: accumulated depreciation and amortisation 7,261 6,560 6,915 6,277
Total aircraft and engines at net book value 8,937 8,608 8,289 8,050