Qantas 2009 Annual Report Download - page 147
Download and view the complete annual report
Please find page 147 of the 2009 Qantas annual report below. You can navigate through the pages in the report by either clicking on the pages listed below, or by using the keyword search tool below to find specific information within the annual report.-
 1
1 -
2
-
3
-
4
-
5
-
6
-
7
-
8
-
9
-
10
-
11
-
12
-
13
-
14
-
15
-
16
-
17
-
18
-
19
-
20
-
21
-
22
-
23
-
24
-
25
-
26
-
27
-
28
-
29
-
30
-
31
-
32
-
33
-
34
-
35
-
36
-
37
-
38
-
39
-
40
-
41
-
42
-
43
-
44
-
45
-
46
-
47
-
48
-
49
-
50
-
51
-
52
-
53
-
54
-
55
-
56
-
57
-
58
-
59
-
60
-
61
-
62
-
63
-
64
-
65
-
66
-
67
-
68
-
69
-
70
-
71
-
72
-
73
-
74
-
75
-
76
-
77
-
78
-
79
-
80
-
81
-
82
-
83
-
84
-
85
-
86
-
87
-
88
-
89
-
90
-
91
-
92
-
93
-
94
-
95
-
96
-
97
-
98
-
99
-
100
-
101
-
102
-
103
-
104
-
105
-
106
-
107
-
108
-
109
-
110
-
111
-
112
-
113
-
114
-
115
-
116
-
117
-
118
-
119
-
120
-
121
-
122
-
123
-
124
-
125
-
126
-
127
-
128
-
129
-
130
-
131
-
132
-
133
-
134
-
135
-
136
-
 137
137 -
 138
138 -
 139
139 -
 140
140 -
 141
141 -
 142
142 -
 143
143 -
 144
144 -
 145
145 -
 146
146 -
 147
147 -
 148
148 -
 149
149 -
 150
150 -
 151
151 -
 152
152 -
 153
153 -
 154
154 -
 155
155 -
 156
156 -
 157
157 -
158
-
159
-
160
-
161
-
162
-
163
-
164
 |
 |

145 Qantas Annual Report 2009
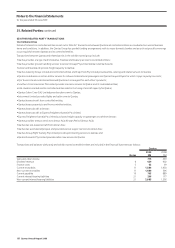
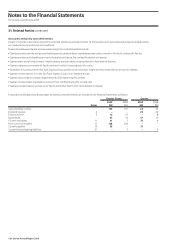
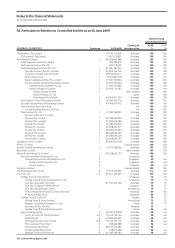
Notes to the Financial Statements
for the year ended 30 June 2009
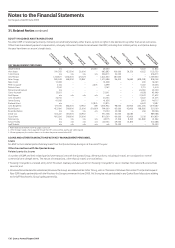
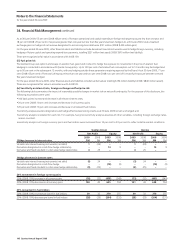
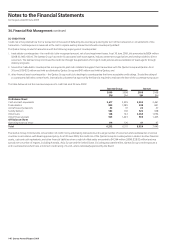
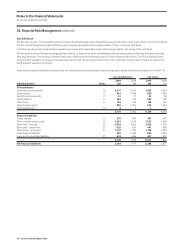
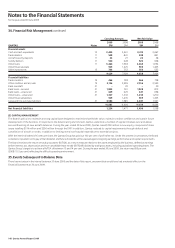
34. Financial Risk Management continued
Asat30June2009,55percent(2008:68percent)offorecastoperationalandcapitalexpenditureforeignexchangeexposureslessthanoneyearand
18percent(2008:20percent)ofexposuresgreaterthanoneyearbutlessthanveyearshavebeenhedged.Asat30June2009,totalunrealised
exchangegainsonhedgesofnetrevenuedesignatedtoservicelong-termdebtwere$121million(2008:$425milliongain).
Fortheyearended30June2009,othernancialassetsandliabilitiesincludederivativenancialinstrumentsusedtohedgeforeigncurrency,including
hedgingoffuturecapitalandoperatingexpenditurepayments,totalling$231million(netasset)(2008:$615million(netliability)).
These are recognised at fair value in accordance with A ASB 139.
(iii) Fuel price risk
TheQantasGroupusesoptionsandswapsonaviationfuel,gasoilandcrudeoiltohedgetheexposuretomovementsinthepriceofaviationfuel.
HedgingisconductedinaccordancewithQantasGrouppolicy.Upto100percentofestimatedfuelconsumptionoutto12monthsmaybehedgedand
upto50percentinthesubsequent12months,withanyhedgingoutsidetheseparametersrequiringapprovalbytheBoard.Asat30June2009,71per
cent(2008:65percent)offorecastfuelexposurelessthanoneyearandtwopercent(2008:twopercent)offorecastfuelexposurebetweenoneand
veyearshavebeenhedged.
Fortheyearended30June2009,othernancialassetsandliabilitiesincludefuelderivativestotalling$154million(liability)(2008:$840million(asset)).
These are recognised at fair value in accordance with A ASB139.
(iv) Sensitivity on interest rate, foreign exchange and fuel price risk
Thefollowingtablesummarisestheimpactofreasonablypossiblechangesinmarketriskonnetprotandequity.Forthepurposeofthisdisclosure,the
following assumptions were used:
•100basispointsincreaseanddecreaseinallrelevantinterestrates;
•20percent(2008:10percent)increaseanddecreaseinallcurrencypairs;
•20percent(2008:10percent)increaseanddecreaseinallrelevantfuelindices;
•sensitivityanalysisassumesdesignationsandhedgeeffectivenesstestingresultsasat30June2009remainunchanged;and
•sensitivityanalysisisisolatedforeachrisk.Forexample,fuelpricesensitivityanalysisassumesallothervariables,includingforeignexchangerates,
remain constant.
•sensitivityanalysisonforeigncurrencypairsandfuelindiceswereincreasedfrom10percentto20percenttoreflectvolatilemarketconditions.
Qantas Group Qantas
Net Profit Equity Net Profit Equity
2009 2008 2009 2008 2009 2008 2009 2008
100bps increase in interest rates $M $M $M $M $M $M $M $M
Variablerateinterestbearinginstruments(netdebt) 1 (24) – – 1 (24) ––
Derivatives designated in a cash flow hedge relationship – – 14 9 – – 14 9
Derivativeandxedratedebtinafairvaluehedgerelationship 4 25 –– 4 25 ––
100bps decrease in interest rates
Variablerateinterestbearinginstruments(netdebt) (1) 24 – – (1) 24 ––
Derivatives designated in a cash flow hedge – – (14) (9) – – (14) (9)
Derivativeandxedratedebtinafairvaluehedgerelationship (5) (25) – – (5) (25) ––
20% movement in foreign currency pairs
20% (2008: 10%) increase in all currency pairs (76) (32) (458) (549) (73) (32) (461) (549)
20% (2008: 10%) decrease in all currency pairs 104 43 625 704 101 43 628 704
20% movement in fuel indices
20%(2008:10%)increaseperbarrelinfuelindices 39 32 279 255 39 32 279 255
20%(2008:10%)decreaseperbarrelinfuelindices (28) (29) (204) (232) (28) (29) (204) (231)