Qantas 2009 Annual Report Download - page 60
Download and view the complete annual report
Please find page 60 of the 2009 Qantas annual report below. You can navigate through the pages in the report by either clicking on the pages listed below, or by using the keyword search tool below to find specific information within the annual report.-
 1
1 -
2
-
3
-
4
-
5
-
6
-
7
-
8
-
9
-
10
-
11
-
12
-
13
-
14
-
15
-
16
-
17
-
18
-
19
-
20
-
21
-
22
-
23
-
24
-
25
-
26
-
27
-
28
-
29
-
30
-
31
-
32
-
33
-
34
-
35
-
36
-
37
-
38
-
39
-
40
-
41
-
42
-
43
-
44
-
45
-
46
-
47
-
48
-
49
-
 50
50 -
 51
51 -
 52
52 -
 53
53 -
 54
54 -
 55
55 -
 56
56 -
 57
57 -
 58
58 -
 59
59 -
 60
60 -
 61
61 -
 62
62 -
 63
63 -
 64
64 -
 65
65 -
 66
66 -
 67
67 -
 68
68 -
 69
69 -
 70
70 -
71
-
72
-
73
-
74
-
75
-
76
-
77
-
78
-
79
-
80
-
81
-
82
-
83
-
84
-
85
-
86
-
87
-
88
-
89
-
90
-
91
-
92
-
93
-
94
-
95
-
96
-
97
-
98
-
99
-
100
-
101
-
102
-
103
-
104
-
105
-
106
-
107
-
108
-
109
-
110
-
111
-
112
-
113
-
114
-
115
-
116
-
117
-
118
-
119
-
120
-
121
-
122
-
123
-
124
-
125
-
126
-
127
-
128
-
129
-
130
-
131
-
132
-
133
-
134
-
135
-
136
-
137
-
138
-
139
-
140
-
141
-
142
-
143
-
144
-
145
-
146
-
147
-
148
-
149
-
150
-
151
-
152
-
153
-
154
-
155
-
156
-
157
-
158
-
159
-
160
-
161
-
162
-
163
-
164
 |
 |

58 Qantas Annual Report 2009
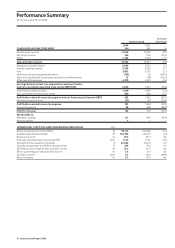
Discussion and Analysis of Performance Summary
for the year ended 30 June 2009
REVIEW OF INCOME STATEMENT
•Profitbeforerelatedincometaxexpense(PBT)was$181million,a
decreaseof$1.2billionor87.1percent.Profitattributabletomembersof
Qantaswas$117million.Thiswasachieveddespitea1.9percent
decreaseincapacityandadecliningdemandenvironmentinboth
domesticandinternationalmarketsaswellasstrongcompetition.
•Anumberofsignificantitemswereincludedintheresultsfortheyear.
TheseitemsincludedaprofitonsaleofQantasHolidaysof$86million,
achangeinFrequentFlyeraccountingestimateswhichincreased
revenueby$164million,ofwhich$84millionisnon-recurring,
redundanciesof$106millionandaccelerateddepreciationand
impairmentlossesof$170million.
REVIEW OF SALES AND OTHER INCOME
•Totalsalesandotherincomefortheyeardecreasedby$1.1billionto
$14.6billion,adecreaseof6.9percentontheprioryear.
•Netpassengerrevenuedecreasedby$1.1billionor8.7percentto
$11.6billion.Thisreflectedcapacityreductionsof1.9percent,aseat
factordecreaseof1.1percentagepointsandayieldreductionof
4.3percentprimarilyreflectingthedeclineinpremiumandbusiness
traveldemand.
•Netfreightrevenuedecreasedby$195million,or20.3percentto
$764million.Reducedcapacityaswellaslowertradeactivityduetothe
economicdownturncontributedtothedecline.
•Otherrevenuecategoriesincreasedby$225millionto$2.2billion.
ThiswasprimarilyduetotheprofitonsaleofQantasHolidaysand
changesinaccountingestimatesforQantasFrequentFlyer.
REVIEW OF EXPENDITURE
•Manpowerandstaffrelatedexpenditureincreasedby$151millionor
4.3percentto$3.7billion.RedundanciesandEnterpriseBargaining
Agreement(EBA)increaseswerethemaincontributorstothisincrease.
•Aircraftoperatingvariablecostsincreasedby$226millionor8.7percent
to$2.8billionlargelyduetoincreasesinlandingfeesandengineering
materialspricerises.
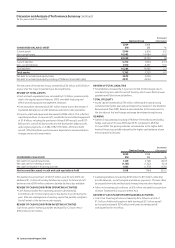
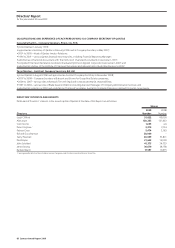
2008
$M %
Currentassets 5,616 6.2
Non-currentassets 14,084 <0.0
Totalassets 19,700 1.8
Currentliabilities 7, 604 (11.7)
Non-currentliabilities 6,361 19.0
Totalliabilities 13,965 2.3
5,735 (0.5)
Netdebttonetdebtplusequity(ratio) 24:76
NetdebttonetdebtplusequityincludingoffBalanceStheetdebt(ratio) 46:54
REVIEW OF EXPENDITUREcontinued
•Fuelcostsdecreasedby$99millionor2.7percent.Increasesintheinto-
planefuelpriceafterhedgingwerelargelyoffsetbyfavourableforeign
exchangemovements.Thevolumeofbarrelsconsumeddecreasedby
3.5percentinlinewithlessflyinghoursfromcapacityreductions.Fuel
conservationandothersavinginitiativesof$62millionalsocontributed
tothedecreaseinfuelcosts.
•Otherexpendituredecreasedby$5millionor0.2percent.Sellingand
marketingsavingswereoffsetbyincreasedpropertycosts,capacityhire
andcommunicationcosts.
•Depreciationandamortisationcostsdecreasedby$79millionor5.4per
cent,mainlyduetodepreciationsavingsonaircraftwrittendowninthe
prioryearandaone-offmaintenanceaccountingchargeforQantasLink
aircraftintheprioryear.
•Non-cancellableoperatingleasechargesincreasedby$50millionor
12.5percentasaresultofunfavourableforeignexchange,aswellasan
increaseinthenumberofleasedaircraft.
•Theshareofnetloss/(profit)inassociatesandjointlycontrolledentities
decreasedby$43milliontoa$15millionloss.LowerearningsfromAir
PacificandJetstarPacificwerethemaincontributorstothischange.
REVIEW OF OTHER INCOME STATEMENT ITEMS
•Ineffectiveandnon-designatedderivativesresultedingainsof
$105millioninthecurrentyearcomparedto$55millionoflosseslastyear.
•Netfinancecostsincreasedby$68million,primarilyduetoalowercash
interestratesreducinginterestincome.
•Theeffectivetaxrateincreasedfrom31.1percentto32.0percent.
•Basicearningspersharedecreasedby43.4centsto5.6centspershare.
Thisreflectedthedecreasedprofitaftertaxfortheyearandincreased
numbersorsharesonissue.
continued
•Fuelcostsdecreasedby$99millionor2.7percent.Theinto-plane
fuelpriceafterhedgingincreasedby8.5percentandaccountedfor
$149millionoftheincreaseincosts.Thevolumeofbarrelsconsumed
decreasedby3.5percentinlinewithlessflyinghoursfromcapacity
reductions.Fuelconservationandothersavinginitiativesalsocontributed
tothedecreaseinfuelcostsof$62million.FluctuatingAustralian
currencymovementsincreasedfuelcostsbutwerenettedoffbyhedging
toprovideanetbenefitof$93million.
•Otherexpendituredecreasedby$29millionor1.1percent.Sellingand
marketingsavingswereoffsetbyincreasedpropertycosts,capacityhire
andcommunicationcosts.TheprioryearincludedFXlossescomparedto
thecurrentyeargainsclassifiedinotherrevenue.
•Depreciationandamortisationcostsdecreasedby$79millionor5.4per
cent,largelyduetothewritedownofaircraftintheprioryearnolonger
beingdepreciated.
•Non-cancellableoperatingleasechargesincreasedby$50millionor12.5
percentasaresultofunfavourableFXandpricing,despiteloweractivity.
•Theshareofnetprofit/(loss)inassociatesandjointlycontrolledentities
decreasedby$43milliontoa$15millionloss.LowerearningsfromAir
PacificandJetstarPacificinvestmentswerethemaincontributors.
•Themark-to-marketopenderivativepositionsoncapitalexpenditure,
requiredunderAASB139,resultedinineffectivederivativegainson
capitalexpenditureof$110millioninthecurrentyearcomparedto
$39millionoflosseslastyear.
•Netfinancecostsincreasedby$68million,primarilyduetoalowercash
interestratesreducinginterestincome.Aslightincreaseinfinancing
costscontributedtotheincrease.
•Thefavourablenetimpactofforeignexchangeratemovementson
overallPBTwas$98million.
•Theeffectivetaxrateincreasedfrom31.1percentto32.0percent.
Basicearningspersharedecreasedby42.5centsto6.5centspershare.
Thisreflectedthedecreasedprofitaftertaxfortheyear.