Office Depot 2012 Annual Report Download - page 95
Download and view the complete annual report
Please find page 95 of the 2012 Office Depot annual report below. You can navigate through the pages in the report by either clicking on the pages listed below, or by using the keyword search tool below to find specific information within the annual report.-
 1
1 -
2
-
3
-
4
-
5
-
6
-
7
-
8
-
9
-
10
-
11
-
12
-
13
-
14
-
15
-
16
-
17
-
18
-
19
-
20
-
21
-
22
-
23
-
24
-
25
-
26
-
27
-
28
-
29
-
30
-
31
-
32
-
33
-
34
-
35
-
36
-
37
-
38
-
39
-
40
-
41
-
42
-
43
-
44
-
45
-
46
-
47
-
48
-
49
-
50
-
51
-
52
-
53
-
54
-
55
-
56
-
57
-
58
-
59
-
60
-
61
-
62
-
63
-
64
-
65
-
66
-
67
-
68
-
69
-
70
-
71
-
72
-
73
-
74
-
75
-
76
-
77
-
78
-
79
-
80
-
81
-
82
-
83
-
84
-
 85
85 -
 86
86 -
 87
87 -
 88
88 -
 89
89 -
 90
90 -
 91
91 -
 92
92 -
 93
93 -
 94
94 -
 95
95 -
 96
96 -
 97
97 -
 98
98 -
 99
99 -
 100
100 -
 101
101 -
 102
102 -
 103
103 -
 104
104 -
 105
105 -
106
-
107
-
108
-
109
-
110
-
111
-
112
-
113
-
114
-
115
-
116
-
117
-
118
-
119
-
120
-
121
-
122
-
123
-
124
-
125
-
126
-
127
-
128
-
129
-
130
-
131
-
132
-
133
-
134
-
135
-
136
-
137
-
138
-
139
-
140
-
141
-
142
-
143
-
144
-
145
-
146
-
147
-
148
-
149
-
150
-
151
-
152
-
153
-
154
-
155
-
156
-
157
-
158
-
159
-
160
-
161
-
162
-
163
-
164
-
165
-
166
-
167
-
168
-
169
-
170
-
171
-
172
-
173
-
174
 |
 |

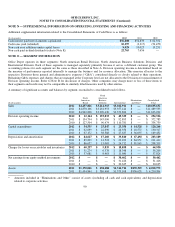
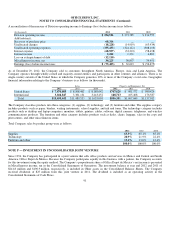
OFFICE DEPOT, INC.
NOTES TO CONSOLIDATED FINANCIAL STATEMENTS (Continued)
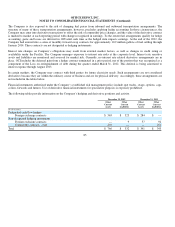
The Company also participates in a joint venture operating in India. The investment in and results of operations for that entity are
considered immaterial for all periods. The following tables provide summarized information from the balance sheets and statements
of income for Office Depot de Mexico:
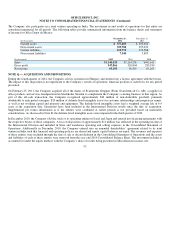
NOTE Q — ACQUISITION AND DISPOSITIONS
During the fourth quarter of 2012, the Company sold its operations in Hungary and entered into a license agreement with the buyers.
The impact of this disposition is not significant to the Company’s results of operations, financial position or cash flows for any period
presented.
On February 25, 2011, the Company acquired all of the shares of Svanströms Gruppen (Frans Svanströms & Co AB), a supplier o
f
office products and services headquartered in Stockholm, Sweden to complement the Company’s existing business in that region. As
part of this all-cash transaction, the Company recognized approximately $46 million of non-deductible goodwill, primarily
attributable to anticipated synergies, $20 million of definite-lived intangible assets for customer relationships and proprietary names,
as well as net working capital and property and equipment. The definite-lived intangible assets had a weighted average life of 6.9
years at the acquisition date. Operations have been included in the International Division results since the date of acquisition.
Supplemental pro forma information as if the entities were combined at earlier periods is not provided based on materiality
considerations. As discussed in Note D, the definite-lived intangible assets were impaired in the third quarter of 2012.
In December 2010, the Company sold the stock of its operating entities in Israel and Japan and entered into licensing agreements with
the respective buyers of those companies. A loss on disposition of approximately $11 million was reflected in the operating income o
f
the International Division and included in Store and warehouse operating and selling expenses in the Consolidated Statement o
f
Operations. Additionally in December 2010, the Company entered into an amended shareholders’ agreement related to its joint
venture in India such that financial and operating policies are shared and equity capital balances are equal. The revenues and expenses
of these entities were included through the date of sale or deconsolidation in the Consolidated Statement of Operations and the assets
and liabilities of each of these entities were removed from the year end 2010 Consolidated Balance Sheet. The investment in India is
accounted for under the equity method, with the Company’s share of results being presented in Miscellaneous income, net.
92
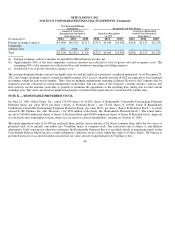
(In thousands)
December 29,
2012
December 31,
2011
Current assets
$377,405
$303,404
Non-current assets
333,788
295,033
Current liabilities
219,774
199,588
Non-current liabilities
7,344
5,895
(In thousands) 2012 2011 2010
Sales
$1,144,02
0
$1,114,201
$961,616
Gross
p
rofit
347,866
326,804
283,189
Net income
63,183
61,951
61,269