Office Depot 2012 Annual Report Download - page 170
Download and view the complete annual report
Please find page 170 of the 2012 Office Depot annual report below. You can navigate through the pages in the report by either clicking on the pages listed below, or by using the keyword search tool below to find specific information within the annual report.-
 1
1 -
2
-
3
-
4
-
5
-
6
-
7
-
8
-
9
-
10
-
11
-
12
-
13
-
14
-
15
-
16
-
17
-
18
-
19
-
20
-
21
-
22
-
23
-
24
-
25
-
26
-
27
-
28
-
29
-
30
-
31
-
32
-
33
-
34
-
35
-
36
-
37
-
38
-
39
-
40
-
41
-
42
-
43
-
44
-
45
-
46
-
47
-
48
-
49
-
50
-
51
-
52
-
53
-
54
-
55
-
56
-
57
-
58
-
59
-
60
-
61
-
62
-
63
-
64
-
65
-
66
-
67
-
68
-
69
-
70
-
71
-
72
-
73
-
74
-
75
-
76
-
77
-
78
-
79
-
80
-
81
-
82
-
83
-
84
-
85
-
86
-
87
-
88
-
89
-
90
-
91
-
92
-
93
-
94
-
95
-
96
-
97
-
98
-
99
-
100
-
101
-
102
-
103
-
104
-
105
-
106
-
107
-
108
-
109
-
110
-
111
-
112
-
113
-
114
-
115
-
116
-
117
-
118
-
119
-
120
-
121
-
122
-
123
-
124
-
125
-
126
-
127
-
128
-
129
-
130
-
131
-
132
-
133
-
134
-
135
-
136
-
137
-
138
-
139
-
140
-
141
-
142
-
143
-
144
-
145
-
146
-
147
-
148
-
149
-
150
-
151
-
152
-
153
-
154
-
155
-
156
-
157
-
158
-
159
-
 160
160 -
 161
161 -
 162
162 -
 163
163 -
 164
164 -
 165
165 -
 166
166 -
 167
167 -
 168
168 -
 169
169 -
 170
170 -
 171
171 -
 172
172 -
 173
173 -
 174
174
 |
 |

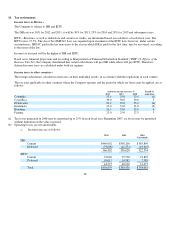
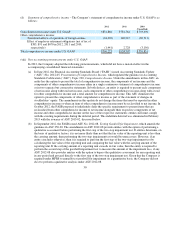
The Company’s financial instruments consist principally of cash, accounts receivable, trade accounts
payable and accrued expenses. The Company believes that the recorded values of these financial
instruments approximate their current fair values because of their nature and respective maturity dates or
durations.
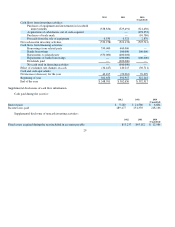
28
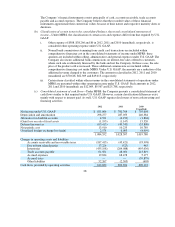
(b) Classification of certain items in the consolidated balance sheets and consolidated statements of
income—Under MFRS, the classification of certain costs and expenses differ from that required by U.S.
GAAP.
i. Other expense of $588, $38,266 and $0 in 2012, 2011 and 2010 (unaudited), respectively, is
considered other o
p
eratin
g
ex
p
ense under U.S. GAAP.
ii. Normal bank commissions stemming from credit card transactions are included within
comprehensive financing cost in the consolidated statements of income under MFRS; these
amounts are included within selling, administrative and general expenses under U.S. GAAP. The
Company also incurs additional bank commissions on interest-free sales offered to customers,
where such sale is ultimately financed by the bank and not the Company. In those cases, the sale
price of the product sold is increased. Those additional commissions are included within
comprehensive financing cost under MFRS. Under U.S. GAAP, the amounts are a reduction of the
additional revenue charged to the customers. The amounts reclassified in 2012, 2011 and 2010
(unaudited) are $70,618, $62,309 and $49,013, res
p
ectivel
y
.
iii. Certain items classified within other revenues in the consolidated statements of operations under
MFRS are presented within other operating income under U.S. GAAP. Such amounts in 2012,
2011 and 2010 (unaudited) are $12,069, $9,567 and $25,788, res
p
ectivel
y
.
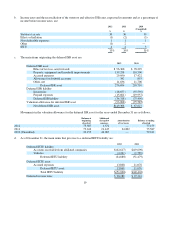
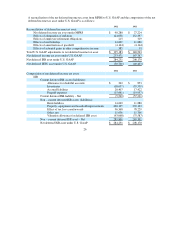
(c) Consolidated statement of cash flows
—
Under MFRS, the Company presents a consolidated statement of
cash flows similar to that required under U.S. GAAP. However, certain classification differences exist,
mainly with respect to interest paid. As well, U.S. GAAP requires disclosures of non-cash investing and
financin
g
activities.
2012 2011 2010
(Unaudited)
Net income under U.S. GAAP
$831,866 $ 781,764
$793,698
De
p
reciation and amortization
298,277
287,053
240,384
Allowance for doubtful accounts
4,531
(6,150)
(1,804)
(Gain) loss on sale of fixed assets
(1,195)
(1,147)
15,52
0
Deferred income tax
(65,415)
(49,343)
(33,808)
Net
p
eriodic cost
13,910
10,235
10,789
Unrealized forei
g
n exchan
g
e loss (
g
ain)
2,578
6,095
(4,999)
1,084,552
1,028,507
1,019,78
0
Chan
g
es in o
p
eratin
g
assets and liabilities:
Accounts receivable and recoverable taxes
(187,415)
(45,421)
(93,998)
Due to/from related
p
arties
17,226 (527)
463
Inventories
(435,198) (204,088)
(495,636)
Trade accounts
p
a
y
able
61,564
48,050
213,819
Accrued ex
p
enses
19,834
68,478
5,177
Accrued taxes
—
—
(39,879)
Other liabilities
52,267
(2,305)
(603)
Cash flows
p
rovided b
y
o
p
eratin
g
activities
612,830
892,694
609,123