Office Depot 2012 Annual Report Download - page 32
Download and view the complete annual report
Please find page 32 of the 2012 Office Depot annual report below. You can navigate through the pages in the report by either clicking on the pages listed below, or by using the keyword search tool below to find specific information within the annual report.-
 1
1 -
2
-
3
-
4
-
5
-
6
-
7
-
8
-
9
-
10
-
11
-
12
-
13
-
14
-
15
-
16
-
17
-
18
-
19
-
20
-
21
-
 22
22 -
 23
23 -
 24
24 -
 25
25 -
 26
26 -
 27
27 -
 28
28 -
 29
29 -
 30
30 -
 31
31 -
 32
32 -
 33
33 -
 34
34 -
 35
35 -
 36
36 -
 37
37 -
 38
38 -
 39
39 -
 40
40 -
 41
41 -
 42
42 -
43
-
44
-
45
-
46
-
47
-
48
-
49
-
50
-
51
-
52
-
53
-
54
-
55
-
56
-
57
-
58
-
59
-
60
-
61
-
62
-
63
-
64
-
65
-
66
-
67
-
68
-
69
-
70
-
71
-
72
-
73
-
74
-
75
-
76
-
77
-
78
-
79
-
80
-
81
-
82
-
83
-
84
-
85
-
86
-
87
-
88
-
89
-
90
-
91
-
92
-
93
-
94
-
95
-
96
-
97
-
98
-
99
-
100
-
101
-
102
-
103
-
104
-
105
-
106
-
107
-
108
-
109
-
110
-
111
-
112
-
113
-
114
-
115
-
116
-
117
-
118
-
119
-
120
-
121
-
122
-
123
-
124
-
125
-
126
-
127
-
128
-
129
-
130
-
131
-
132
-
133
-
134
-
135
-
136
-
137
-
138
-
139
-
140
-
141
-
142
-
143
-
144
-
145
-
146
-
147
-
148
-
149
-
150
-
151
-
152
-
153
-
154
-
155
-
156
-
157
-
158
-
159
-
160
-
161
-
162
-
163
-
164
-
165
-
166
-
167
-
168
-
169
-
170
-
171
-
172
-
173
-
174
 |
 |

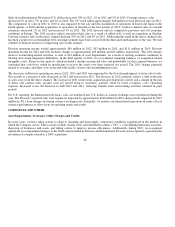
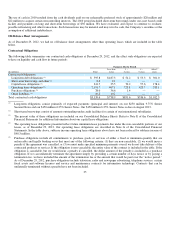
The charges in 2010 include $51 million for the abandonment of a certain software application, $23 million for losses on the disposal
of operating entities in Israel and Japan, as well as $13 million of compensation-related costs following the departure of the
Company’s former CEO.
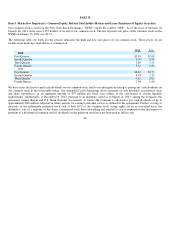
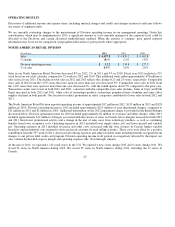
The following table indicates the amount of charges and credits included in the determination of Division operating income and
recognized at the corporate level:
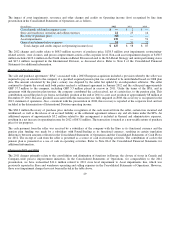
General and Administrative Expenses
Total general and administrative expenses (“G&A”) decreased to $673 million in 2012 from $689 million in 2011. The portion o
f
G&A expenses considered directly or closely related to division activity is included in the measurement of Division operating
income. Other companies may charge more or less G&A expenses and other costs to their segments, and our results therefore may not
be comparable to similarly titled measures used by other companies. The remainder of the total G&A expenses are considered
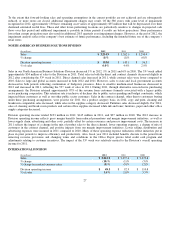
corporate expenses. A breakdown of G&A is provided in the following table:
As noted above in “Asset Impairments, Severance, Other Charges and Credits”, total G&A expenses include charges of $34 million,
$31 million, and $22 million in 2012, 2011, and 2010, respectively. Of these amounts, approximately $16 million was included in
Division G&A for 2012, $17 million in 2011, and $9 million in 2010. The remaining amounts in each year were included in
Corporate G&A. After considering these charges, Corporate G&A expenses increased in 2012 from additional project costs and
personnel intended to improve performance in future periods, partially offset by lower variable pay. Corporate G&A expenses
increased in 2011 from higher variable based pay and the comparison to a favorable litigation settlement in 2010.
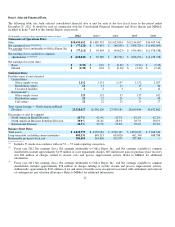
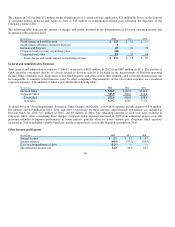
Other Income and Expense
30
(In millions) 2012 2011 2010
North American Retail Division
$125
$12
$
—
North America Business Solutions Division
3
—
—
International Division
49
31
23
Cor
p
orate level, recover
y
of
p
urchase
p
rice
(68)
—
—
Cor
p
orate level, other
18 15
64
Total char
g
es and credits im
p
act on O
p
eratin
g
income
$ 127
$ 58
$ 87
(In millions) 2012 2011 2010
Division G&A
$ 326.9
$362.6
$342.2
Cor
p
orate G&A
345.9
326.0
316.6
Total G&A
672.8
688.6
658.8
% of sales
6.3%
6.0%
5.7%
(In millions) 2012 2011 2010
Interest income
$ 2.2
$ 1.2
$ 4.7
Interest ex
p
ense
(68.9)
(33.2)
(58.5)
Loss on extin
g
uishment of debt
(12.1)
—
—
Miscellaneous income, net
34.2
30.9
34.5