Office Depot 2012 Annual Report Download - page 24
Download and view the complete annual report
Please find page 24 of the 2012 Office Depot annual report below. You can navigate through the pages in the report by either clicking on the pages listed below, or by using the keyword search tool below to find specific information within the annual report.-
 1
1 -
2
-
3
-
4
-
5
-
6
-
7
-
8
-
9
-
10
-
11
-
12
-
13
-
 14
14 -
 15
15 -
 16
16 -
 17
17 -
 18
18 -
 19
19 -
 20
20 -
 21
21 -
 22
22 -
 23
23 -
 24
24 -
 25
25 -
 26
26 -
 27
27 -
 28
28 -
 29
29 -
 30
30 -
 31
31 -
 32
32 -
 33
33 -
 34
34 -
35
-
36
-
37
-
38
-
39
-
40
-
41
-
42
-
43
-
44
-
45
-
46
-
47
-
48
-
49
-
50
-
51
-
52
-
53
-
54
-
55
-
56
-
57
-
58
-
59
-
60
-
61
-
62
-
63
-
64
-
65
-
66
-
67
-
68
-
69
-
70
-
71
-
72
-
73
-
74
-
75
-
76
-
77
-
78
-
79
-
80
-
81
-
82
-
83
-
84
-
85
-
86
-
87
-
88
-
89
-
90
-
91
-
92
-
93
-
94
-
95
-
96
-
97
-
98
-
99
-
100
-
101
-
102
-
103
-
104
-
105
-
106
-
107
-
108
-
109
-
110
-
111
-
112
-
113
-
114
-
115
-
116
-
117
-
118
-
119
-
120
-
121
-
122
-
123
-
124
-
125
-
126
-
127
-
128
-
129
-
130
-
131
-
132
-
133
-
134
-
135
-
136
-
137
-
138
-
139
-
140
-
141
-
142
-
143
-
144
-
145
-
146
-
147
-
148
-
149
-
150
-
151
-
152
-
153
-
154
-
155
-
156
-
157
-
158
-
159
-
160
-
161
-
162
-
163
-
164
-
165
-
166
-
167
-
168
-
169
-
170
-
171
-
172
-
173
-
174
 |
 |

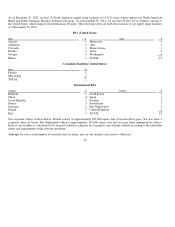
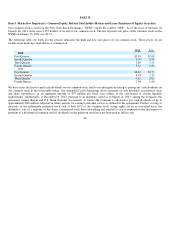
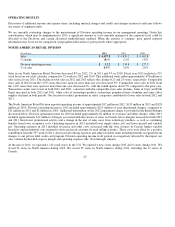
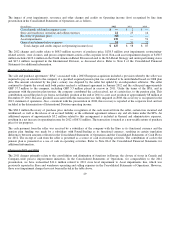
Item 6. Selected Financial Data.
The following table sets forth selected consolidated financial data at and for each of the five fiscal years in the period ended
December 29, 2012. It should be read in conjunction with the Consolidated Financial Statements and Notes thereto and MD&A,
included in Items 7 and 8 of this Annual Report, respectively.
22
(In thousands, exce
p
t
p
er share amounts and statistical data)
2012
2011
2010
2009
2008
Statements of Operations Data:
Sales
$10,695,65
2
$11,489,533
$11,633,094
$12,144,467
$14,495,544
Net earnin
g
s (loss)
$(77,12
0
)
$95,691
$(46,205)
$(598,724)
$(1,481,003)
Net earnings (loss) attributable to Office Depot, Inc.
$ (77,111)
$ 95,694
$ (44,623)
$ (596,465)
$ (1,478,938)
Net earnings (loss) available to common
shareholders
$(110,045)
$59,989
$(81,736)
$(626,971)
$(1,478,938)
Net earnin
g
s (loss)
p
er share:
Basic
$(0.39) $0.22 $ (0.3
0
)
$(2.30)
$(5.42)
Diluted
$(0.39) $0.22 $(0.3
0
)
$ (2.30)
$ (5.42)
Statistical Data:
Facilities o
p
en at end of
p
eriod:
United States:
Office su
pp
l
y
stores
1,11
2
1,131
1,147
1,152
1,267
Distribution centers
13
13
13
15
20
Crossdock facilities
2
2
3
6
12
International :
Office su
pp
l
y
stores
123 131 97
137
162
Distribution centers
23
27
26
39
43
Call centers
21
22
25
29
27
Total square footage
—
North American Retail
Division
25,518,02
7
26,556,126
27,559,184
28,109,844
30,672,862
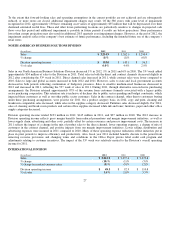
Percenta
g
e of sales b
y
se
g
ment:
North American Retail Division
41.7%
42.4%
42.7%
42.1%
42.2%
North American Business Solutions Division
30.0% 28.4% 28.3%
28.7%
28.6%
International Division
28.3% 29.2% 29.0%
29.2%
29.2%
Balance Sheet Data:
Total assets
$4,010,779
$4,250,984
$4,569,437
$4,890,346
$5,268,226
Lon
g
-term debt, excludin
g
current maturities
485,331
648,313
659,82
0
662,74
0
688,788
Redeemable
p
referred stock, net
386,401
363,636
355,979
355,308
—
Includes 53 weeks in accordance with our 52
—
53 week re
p
ortin
g
convention.
Fiscal year 2012 Net earnings (loss), Net earnings attributable to Office Depot, Inc., and Net earnings available to commo
n
shareholders include approximately $139 million of asset impairment charges, $63 million net gain on purchase price recovery
and $56 million of charges related to closure costs and process improvement activity. Refer to MD&A for additional
information.
Fiscal year 2011 Net earnings (loss), Net earnings attributable to Office Depot, Inc., and Net earnings available to commo
n
shareholders includes approximately $58 million of charges relating to facility closure and process improvement activity.
Additionally, approximately $123 million of tax and interest benefits were recognized associated with settlements and removal
of contin
g
encies and valuation allowances. Refer to MD&A for additional information.
(1)
(2)(3)(4)(5)(6)
(2)(3)(4)(5)(6)
(2)(3)(4)(5)(6)
(7)
(1)
(2)
(3)