Office Depot 2012 Annual Report Download - page 59
Download and view the complete annual report
Please find page 59 of the 2012 Office Depot annual report below. You can navigate through the pages in the report by either clicking on the pages listed below, or by using the keyword search tool below to find specific information within the annual report.-
 1
1 -
2
-
3
-
4
-
5
-
6
-
7
-
8
-
9
-
10
-
11
-
12
-
13
-
14
-
15
-
16
-
17
-
18
-
19
-
20
-
21
-
22
-
23
-
24
-
25
-
26
-
27
-
28
-
29
-
30
-
31
-
32
-
33
-
34
-
35
-
36
-
37
-
38
-
39
-
40
-
41
-
42
-
43
-
44
-
45
-
46
-
47
-
48
-
 49
49 -
 50
50 -
 51
51 -
 52
52 -
 53
53 -
 54
54 -
 55
55 -
 56
56 -
 57
57 -
 58
58 -
 59
59 -
 60
60 -
 61
61 -
 62
62 -
 63
63 -
 64
64 -
 65
65 -
 66
66 -
 67
67 -
 68
68 -
 69
69 -
70
-
71
-
72
-
73
-
74
-
75
-
76
-
77
-
78
-
79
-
80
-
81
-
82
-
83
-
84
-
85
-
86
-
87
-
88
-
89
-
90
-
91
-
92
-
93
-
94
-
95
-
96
-
97
-
98
-
99
-
100
-
101
-
102
-
103
-
104
-
105
-
106
-
107
-
108
-
109
-
110
-
111
-
112
-
113
-
114
-
115
-
116
-
117
-
118
-
119
-
120
-
121
-
122
-
123
-
124
-
125
-
126
-
127
-
128
-
129
-
130
-
131
-
132
-
133
-
134
-
135
-
136
-
137
-
138
-
139
-
140
-
141
-
142
-
143
-
144
-
145
-
146
-
147
-
148
-
149
-
150
-
151
-
152
-
153
-
154
-
155
-
156
-
157
-
158
-
159
-
160
-
161
-
162
-
163
-
164
-
165
-
166
-
167
-
168
-
169
-
170
-
171
-
172
-
173
-
174
 |
 |

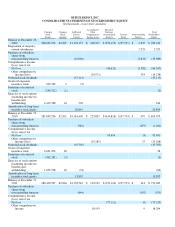
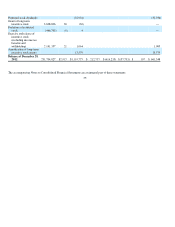
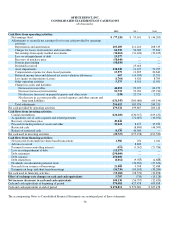
OFFICE DEPOT, INC.
CONSOLIDATED STATEMENTS OF CASH FLOWS
(In thousands)
The accompanying Notes to Consolidated Financial Statements are an integral part of these statements.
56
2012 2011 2010
Cash flows from operating activities:
Net earnin
g
s (loss)
$(77,120)
$ 95,691
$(46,205)
Adjustments to reconcile net earnings (loss) to net cash provided by operating
activities:
De
p
reciation and amortization
203,189
211,410
208,319
Char
g
es for losses on inventories and receivables
64,930
56,200
57,824
Net earnin
g
s from e
q
uit
y
method investments
(30,462)
(31,426)
(30,635)
Loss on extin
g
uishment of debt
13,377
_
_
__
Recover
y
of
p
urchase
p
rice
(58,049)
_
_
__
Pension
p
lan fundin
g
(58,030)
_
_
__
Dividends received
_
_
25,016
—
Asset im
p
airments
138,540
11,427
51,295
Com
p
ensation ex
p
ense for share-based
p
a
y
ments
13,579
13,895
20,840
Deferred income taxes and deferred tax assets valuation allowances
667
(14,999)
15,551
Loss (
g
ain) on dis
p
osition of assets
(1,764)
4,420
8,709
Other o
p
eratin
g
activities
5,375
8,510
11,501
Chan
g
es in assets and liabilities:
Decrease in receivables
44,052
99,927
60,273
Decrease (increase) in inventories
52,733
53,902
(87,724)
Net decrease (increase) in
p
re
p
aid ex
p
enses and other assets
(138)
25,754
2,522
Net decrease in accounts payable, accrued expenses and other current and
lon
g
-term liabilities
(131,547)
(360,060)
(69,144)
Total ad
j
ustments
256,452
103,976
249,331
Net cash
p
rovided b
y
o
p
eratin
g
activities
179,332
199,667
203,126
Cash flows from investing activities:
Ca
p
ital ex
p
enditures
(120,260)
(130,317)
(169,452)
Ac
q
uisitions, net of cash ac
q
uired, and related
p
a
y
ments
_
_
(72,667)
(10,952)
Recover
y
of
p
urchase
p
rice
49,841
_
_
__
Proceeds from dis
p
osition of assets and other
32,122
8,117
35,393
Restricted cash
_
_
(8,800)
(46,509)
Release of restricted cash
8,570
46,509
—
Net cash used in investin
g
activities
(29,727)
(157,158)
(191,520)
Cash flows from financing activities:
Net
p
roceeds from em
p
lo
y
ee share-based transactions
1,586
254
1,011
Advance received
_
_
8,800
—
Pa
y
ment for non-controllin
g
interests
(551)
(1,262)
(21,786)
Loss on extin
g
uishment of debt
(13,377)
_
_
__
Debt retirement
(250,000)
_
_
__
Debt issuance
250,000
_
_
__
Debt related fees
(8,012)
(9,945)
(4,688)
Dividends on redeemable
p
referred stoc
k
_
_
(36,852)
(27,639)
Proceeds from issuance of borrowin
g
s
21,908
9,598
52,488
Pa
y
ments on lon
g
- and short-term borrowin
g
s
(56,736)
(69,169)
(30,284)
Net cash used in financin
g
activities
(55,182)
(98,576)
(30,898)
Effect of exchange rate changes on cash and cash equivalents
5,707
(730)
(13,128)
Net increase (decrease) in cash and cash equivalents
100,130
(56,797)
(32,420)
Cash and cash e
q
uivalents at be
g
innin
g
of
p
eriod
570,681
627,478
659,898
Cash and cash e
q
uivalents at end of
p
eriod
$ 670,811
$ 570,681
$ 627,478