Office Depot 2012 Annual Report Download - page 66
Download and view the complete annual report
Please find page 66 of the 2012 Office Depot annual report below. You can navigate through the pages in the report by either clicking on the pages listed below, or by using the keyword search tool below to find specific information within the annual report.-
 1
1 -
2
-
3
-
4
-
5
-
6
-
7
-
8
-
9
-
10
-
11
-
12
-
13
-
14
-
15
-
16
-
17
-
18
-
19
-
20
-
21
-
22
-
23
-
24
-
25
-
26
-
27
-
28
-
29
-
30
-
31
-
32
-
33
-
34
-
35
-
36
-
37
-
38
-
39
-
40
-
41
-
42
-
43
-
44
-
45
-
46
-
47
-
48
-
49
-
50
-
51
-
52
-
53
-
54
-
55
-
 56
56 -
 57
57 -
 58
58 -
 59
59 -
 60
60 -
 61
61 -
 62
62 -
 63
63 -
 64
64 -
 65
65 -
 66
66 -
 67
67 -
 68
68 -
 69
69 -
 70
70 -
 71
71 -
 72
72 -
 73
73 -
 74
74 -
 75
75 -
 76
76 -
77
-
78
-
79
-
80
-
81
-
82
-
83
-
84
-
85
-
86
-
87
-
88
-
89
-
90
-
91
-
92
-
93
-
94
-
95
-
96
-
97
-
98
-
99
-
100
-
101
-
102
-
103
-
104
-
105
-
106
-
107
-
108
-
109
-
110
-
111
-
112
-
113
-
114
-
115
-
116
-
117
-
118
-
119
-
120
-
121
-
122
-
123
-
124
-
125
-
126
-
127
-
128
-
129
-
130
-
131
-
132
-
133
-
134
-
135
-
136
-
137
-
138
-
139
-
140
-
141
-
142
-
143
-
144
-
145
-
146
-
147
-
148
-
149
-
150
-
151
-
152
-
153
-
154
-
155
-
156
-
157
-
158
-
159
-
160
-
161
-
162
-
163
-
164
-
165
-
166
-
167
-
168
-
169
-
170
-
171
-
172
-
173
-
174
 |
 |

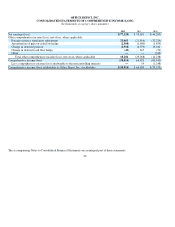
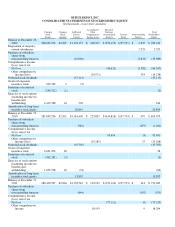
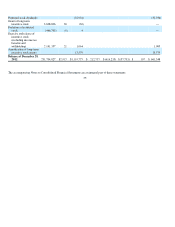
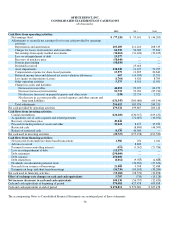
OFFICE DEPOT, INC.
NOTES TO CONSOLIDATED FINANCIAL STATEMENTS (Continued)
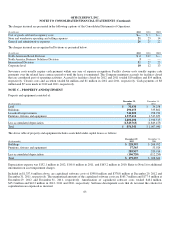
The charges incurred are presented in the following captions of the Consolidated Statements of Operations.
The charges incurred are recognized in Divisions as presented below.
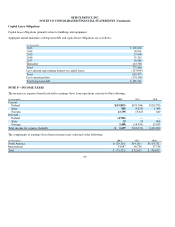
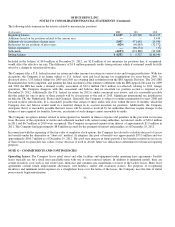
Severance costs usually require cash payment within one year of expense recognition. Facility closure costs usually require cash
payments over the related lease contract period or until the lease is terminated. The Company maintains accruals for facilities closed
that are considered part of operating activities. Accrual for facilities closed for 2012 and 2011 totaled $10 million and $14 million,
respectively. Closure costs and accretion totaled $4 million and $1 million in 2012 and 2011, respectively. Cash payments of $8
million and $7 were made in 2012 and 2011, respectively.
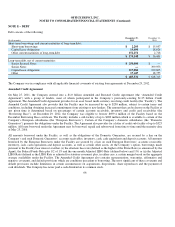
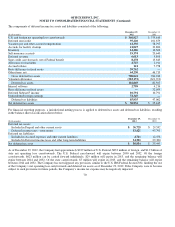
NOTE C – PROPERTY AND EQUIPMENT
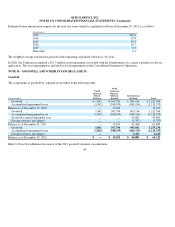
Property and equipment consisted of:
The above table of property and equipment includes assets held under capital leases as follows:
Depreciation expense was $152.1 million in 2012, $161.0 million in 2011, and $163.2 million in 2010. Refer to Note I for additional
information on asset impairment charges.
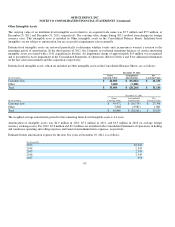
Included in $1,337.6 million above, are capitalized software costs of $398.0 million and $378.8 million at December 29, 2012 and
December 31, 2011, respectively. The unamortized amounts of the capitalized software costs are $165.7 million and $177.9 million at
December 29, 2012 and December 31, 2011, respectively. Amortization of capitalized software costs totaled $46.2 million,
$45.2 million and $42.2 million in 2012, 2011 and 2010, respectively. Software development costs that do not meet the criteria fo
r
capitalization are expensed as incurred.
63
(In millions) 2012 2011 2010
Cost of
g
oods sold and occu
p
anc
y
costs
$
—
$ 1
$
—
Store and warehouse o
p
eratin
g
and sellin
g
ex
p
enses
21
25
14
General and administrative ex
p
enses
26
25
22
(In millions) 2012 2011 2010
North American Retail Division
$ 2
$12
$
—
North America Business Solutions Division
3
—
—
International Division
32
27
23
Cor
p
orate level
10
12
13
(In thousands)
December 29,
2012
December 31,
2011
Land
$31,430
$34,258
Buildin
g
s
290,153
335,862
Leasehold im
p
rovements
746,909
998,736
Furniture, fixtures and e
q
ui
p
ment
1,337,612
1,547,659
2,406,104
2,916,515
Less accumulated de
p
reciation
(1,549,763)
(1,849,475)
Total
$856,341
$1,067,040
(In thousands)
December 29,
2012
December 31,
2011
Buildin
g
s
$228,392
$266,992
Furniture, fixtures and e
q
ui
p
ment
57,565
53,924
285,957
320,916
Less accumulated de
p
reciation
(106,720)
(112,250)
Total
$179,237
$208,666