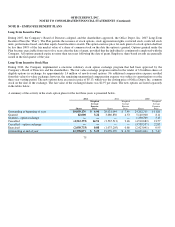
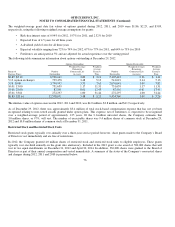
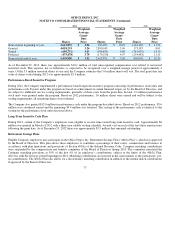
Office Depot 2012 Annual Report Download - page 84
Download and view the complete annual report
Please find page 84 of the 2012 Office Depot annual report below. You can navigate through the pages in the report by either clicking on the pages listed below, or by using the keyword search tool below to find specific information within the annual report.-
 1
1 -
2
-
3
-
4
-
5
-
6
-
7
-
8
-
9
-
10
-
11
-
12
-
13
-
14
-
15
-
16
-
17
-
18
-
19
-
20
-
21
-
22
-
23
-
24
-
25
-
26
-
27
-
28
-
29
-
30
-
31
-
32
-
33
-
34
-
35
-
36
-
37
-
38
-
39
-
40
-
41
-
42
-
43
-
44
-
45
-
46
-
47
-
48
-
49
-
50
-
51
-
52
-
53
-
54
-
55
-
56
-
57
-
58
-
59
-
60
-
61
-
62
-
63
-
64
-
65
-
66
-
67
-
68
-
69
-
70
-
71
-
72
-
73
-
 74
74 -
 75
75 -
 76
76 -
 77
77 -
 78
78 -
 79
79 -
 80
80 -
 81
81 -
 82
82 -
 83
83 -
 84
84 -
 85
85 -
 86
86 -
 87
87 -
 88
88 -
 89
89 -
 90
90 -
 91
91 -
 92
92 -
 93
93 -
 94
94 -
95
-
96
-
97
-
98
-
99
-
100
-
101
-
102
-
103
-
104
-
105
-
106
-
107
-
108
-
109
-
110
-
111
-
112
-
113
-
114
-
115
-
116
-
117
-
118
-
119
-
120
-
121
-
122
-
123
-
124
-
125
-
126
-
127
-
128
-
129
-
130
-
131
-
132
-
133
-
134
-
135
-
136
-
137
-
138
-
139
-
140
-
141
-
142
-
143
-
144
-
145
-
146
-
147
-
148
-
149
-
150
-
151
-
152
-
153
-
154
-
155
-
156
-
157
-
158
-
159
-
160
-
161
-
162
-
163
-
164
-
165
-
166
-
167
-
168
-
169
-
170
-
171
-
172
-
173
-
174
 |
 |

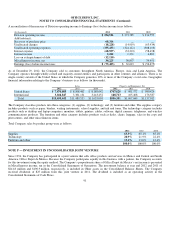
OFFICE DEPOT, INC.
NOTES TO CONSOLIDATED FINANCIAL STATEMENTS (Continued)
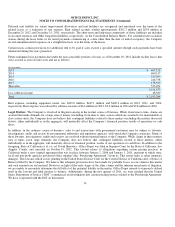
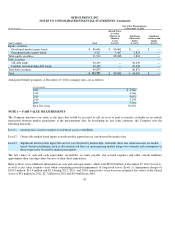
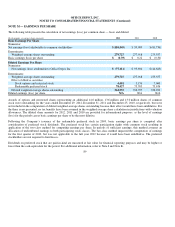
Anticipated benefit payments, at December 29, 2012 exchange rates, are as follows:
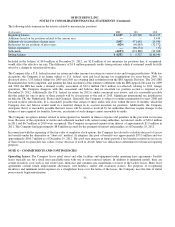
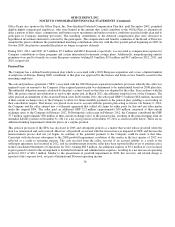
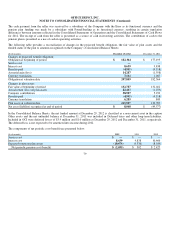
NOTE I — FAIR VALUE MEASUREMENTS
The Company measures fair value as the price that would be received to sell an asset or paid to transfer a liability in an orderly
transaction between market participants at the measurement date. In developing its fair value estimates, the Company uses the
following hierarchy:
The fair values of cash and cash equivalents, receivables, accounts payable and accrued expenses and other current liabilities
approximate their carrying values because of their short-term nature.
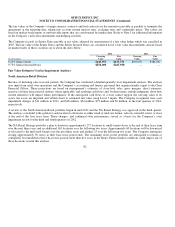
Refer to Note A for additional information on cash and cash equivalents, which total $670.8 million at December 29, 2012 (Level 1),
as well as fair value estimates used when considering potential impairments of long-lived assets (Level 3). Impairment charges o
f
$138.5 million, $11.4 million and $2.3 during 2012, 2011, and 2010, respectively, were based on estimated fair values of the related
assets of $42 million in 2012, $1.7 million in 2011 and $0.4 million in 2010.
81
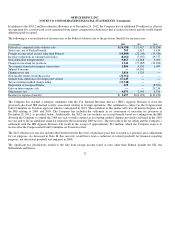
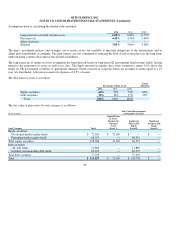
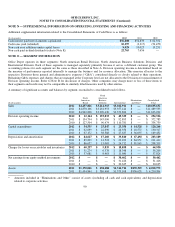
(In thousands)
Fair Value Measurements
at December 31, 2011
Asset Category Total
Quoted Prices
in Active
Markets for
Identical
Assets
(Level 1)
Significant
Observable
Inputs
(Level 2)
Significan
t
Unobservable
Inputs
(Level 3)
E
q
uit
y
securities
Develo
p
ed market e
q
uit
y
funds
$86,601
$ 86,601
$
—
$
—
Emer
g
in
g
market e
q
uit
y
funds
5,311
1,487
3,824
—
Total e
q
uit
y
securities
91,912
88,088
3,824
—
Debt securities
—
UK debt funds
30,439
—
30,439
—
Liabilit
y
term matchin
g
debt funds
10,436
—
10,436
—
Total debt securities
40,875
—
40,875
—
Total
$ 132,787
$88,088
$ 44,699
$
—
(In thousands)
2013
$4,764
2014
4,906
2015
5,053
2016
5,204
2017
5,361
Next five
y
ears
29,316
Level 1:
Quoted
p
rices in active markets for identical assets or liabilities.
Level 2:
Observable market based in
p
uts or unobservable in
p
uts that are corroborated b
y
market data.
Level 3:
Significant unobservable inputs that are not corroborated by market data. Generally, these fair value measures are model-
based valuation techniques such as discounted cash flows or option pricing models using own estimates and assumptions or
those ex
p
ected to be used b
y
market
p
artici
p
ants.