Office Depot 2012 Annual Report Download - page 171
Download and view the complete annual report
Please find page 171 of the 2012 Office Depot annual report below. You can navigate through the pages in the report by either clicking on the pages listed below, or by using the keyword search tool below to find specific information within the annual report.-
 1
1 -
2
-
3
-
4
-
5
-
6
-
7
-
8
-
9
-
10
-
11
-
12
-
13
-
14
-
15
-
16
-
17
-
18
-
19
-
20
-
21
-
22
-
23
-
24
-
25
-
26
-
27
-
28
-
29
-
30
-
31
-
32
-
33
-
34
-
35
-
36
-
37
-
38
-
39
-
40
-
41
-
42
-
43
-
44
-
45
-
46
-
47
-
48
-
49
-
50
-
51
-
52
-
53
-
54
-
55
-
56
-
57
-
58
-
59
-
60
-
61
-
62
-
63
-
64
-
65
-
66
-
67
-
68
-
69
-
70
-
71
-
72
-
73
-
74
-
75
-
76
-
77
-
78
-
79
-
80
-
81
-
82
-
83
-
84
-
85
-
86
-
87
-
88
-
89
-
90
-
91
-
92
-
93
-
94
-
95
-
96
-
97
-
98
-
99
-
100
-
101
-
102
-
103
-
104
-
105
-
106
-
107
-
108
-
109
-
110
-
111
-
112
-
113
-
114
-
115
-
116
-
117
-
118
-
119
-
120
-
121
-
122
-
123
-
124
-
125
-
126
-
127
-
128
-
129
-
130
-
131
-
132
-
133
-
134
-
135
-
136
-
137
-
138
-
139
-
140
-
141
-
142
-
143
-
144
-
145
-
146
-
147
-
148
-
149
-
150
-
151
-
152
-
153
-
154
-
155
-
156
-
157
-
158
-
159
-
160
-
 161
161 -
 162
162 -
 163
163 -
 164
164 -
 165
165 -
 166
166 -
 167
167 -
 168
168 -
 169
169 -
 170
170 -
 171
171 -
 172
172 -
 173
173 -
 174
174
 |
 |

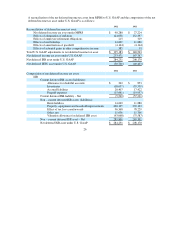
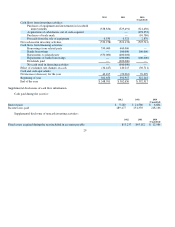
Supplemental disclosures of cash flow information
Cash paid during the year for:
Supplemental disclosure of noncash investing activities:
29
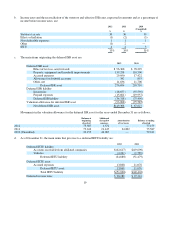
2012 2011 2010
(Unaudited)
Cash flows from investin
g
activities:
Purchases of equipment and investments in leasehold
im
p
rovements
(538,834)
(529,491)
(321,450)
Ac
q
uisitions of subsidiaries, net of cash ac
q
uired
—
(178,353)
Purchases of trade mar
k
—
(10,786)
Proceeds from the sale of e
q
ui
p
ment
6,556
6,321
2,876
Net cash used in investin
g
activities
(532,278)
(523,170)
(507,713)
Cash flows from financin
g
activities:
Borrowin
g
s from related
p
art
y
550,000
400,000
—
Banks borrowin
g
s
—
100,000
100,000
Re
p
a
y
ments to related
p
art
y
(550,000)
(400,000)
—
Re
p
a
y
ments of banks borrowin
g
s
—
(100,000)
(100,000)
Dividends
p
aid
—
(600,000)
—
Net cash used in financin
g
activities
—
(600,000)
—
Effect of exchan
g
e rate chan
g
es on cash
(34,447)
140,215
(30,711)
Cash and cash e
q
uivalents:
Net increase (decrease) for the
y
ear
46,105
(90,261)
70,699
Be
g
innin
g
of
y
ear
302,656
392,917
322,218
End of the
y
ear
$ 348,761
$ 302,656
$ 392,917
2012 2011 2010
(Unaudited)
Interest
p
aid
$5,283
$21,58
0
$6,684
Income taxes
p
aid
289,477
251,339
218,166
2012 2011 2010
(Unaudited)
Fixed assets ac
q
uired durin
g
the
y
ear included in accounts
p
a
y
able
$13,237
$45,152
$12,986