Office Depot 2012 Annual Report Download - page 83
Download and view the complete annual report
Please find page 83 of the 2012 Office Depot annual report below. You can navigate through the pages in the report by either clicking on the pages listed below, or by using the keyword search tool below to find specific information within the annual report.-
 1
1 -
2
-
3
-
4
-
5
-
6
-
7
-
8
-
9
-
10
-
11
-
12
-
13
-
14
-
15
-
16
-
17
-
18
-
19
-
20
-
21
-
22
-
23
-
24
-
25
-
26
-
27
-
28
-
29
-
30
-
31
-
32
-
33
-
34
-
35
-
36
-
37
-
38
-
39
-
40
-
41
-
42
-
43
-
44
-
45
-
46
-
47
-
48
-
49
-
50
-
51
-
52
-
53
-
54
-
55
-
56
-
57
-
58
-
59
-
60
-
61
-
62
-
63
-
64
-
65
-
66
-
67
-
68
-
69
-
70
-
71
-
72
-
 73
73 -
 74
74 -
 75
75 -
 76
76 -
 77
77 -
 78
78 -
 79
79 -
 80
80 -
 81
81 -
 82
82 -
 83
83 -
 84
84 -
 85
85 -
 86
86 -
 87
87 -
 88
88 -
 89
89 -
 90
90 -
 91
91 -
 92
92 -
 93
93 -
94
-
95
-
96
-
97
-
98
-
99
-
100
-
101
-
102
-
103
-
104
-
105
-
106
-
107
-
108
-
109
-
110
-
111
-
112
-
113
-
114
-
115
-
116
-
117
-
118
-
119
-
120
-
121
-
122
-
123
-
124
-
125
-
126
-
127
-
128
-
129
-
130
-
131
-
132
-
133
-
134
-
135
-
136
-
137
-
138
-
139
-
140
-
141
-
142
-
143
-
144
-
145
-
146
-
147
-
148
-
149
-
150
-
151
-
152
-
153
-
154
-
155
-
156
-
157
-
158
-
159
-
160
-
161
-
162
-
163
-
164
-
165
-
166
-
167
-
168
-
169
-
170
-
171
-
172
-
173
-
174
 |
 |

OFFICE DEPOT, INC.
NOTES TO CONSOLIDATED FINANCIAL STATEMENTS (Continued)
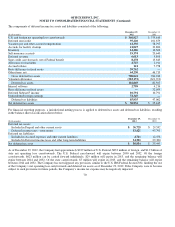
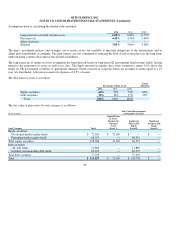
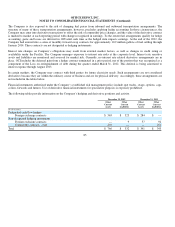
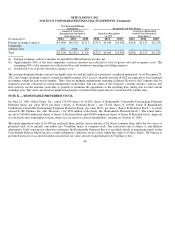
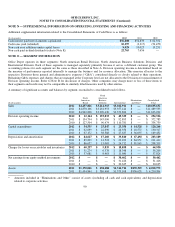
Assumptions used in calculating the funded status included:
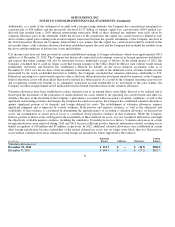
The plan’s investment policies and strategies are to ensure assets are available to meet the obligations to the beneficiaries and to
adjust plan contributions accordingly. The plan trustees are also committed to reducing the level of risk in the plan over the long term,
while retaining a return above that of the growth of liabilities.
The long-term rate of return on assets assumption has been derived based on long-term UK government fixed income yields, having
regard to the proportion of assets in each asset class. The funds invested in equities have been assumed to return 4.0% above the
return on UK government securities of appropriate duration. Funds invested in corporate bonds are assumed to return equal to a 15
year AA bond index. Allowance is made for expenses of 0.5% of assets.
The allocation of assets is as follows:
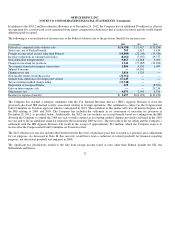
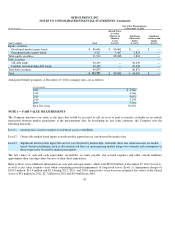
The fair value of plan assets by asset category is as follows:
80
2012 2011 2010
Long-term rate of return on plan assets
6.00%
6.00%
6.77%
Discount rate
4.40%
4.70%
5.40%
Salar
y
increases
—
—
—
Inflation
3.00%
3.00%
3.40%
Percentage of Plan Assets
Targe
t
Allocation
2012 2011 2010
E
q
uit
y
securities
64%
70%
73%
65%
Debt securities
36%
30%
27%
35%
Total
100%
100%
100%
(In thousands)
Fair Value Measurements
at December 29, 2012
Asset Category Total
Quoted Prices
in Active
Markets for
Identical
Assets
(Level 1)
Significan
t
Observable
Inputs
(Level 2)
Significan
t
Unobservable
Inputs
(Level 3)
E
q
uit
y
securities
Develo
p
ed market e
q
uit
y
funds
$72,169
$ 72,169
$
—
$
—
Emer
g
in
g
market e
q
uit
y
funds
66,519
—
66,519
—
Total e
q
uit
y
securities
138,688
72,169
66,519
—
Debt securities
UK debt funds
11,866
—
11,866
—
Liabilit
y
term matchin
g
debt funds
65,373
—
65,373
—
Total debt securities
77,239
—
77,239
—
Total
$ 215,927
$72,169
$ 143,758
$
—