Office Depot 2012 Annual Report Download - page 55
Download and view the complete annual report
Please find page 55 of the 2012 Office Depot annual report below. You can navigate through the pages in the report by either clicking on the pages listed below, or by using the keyword search tool below to find specific information within the annual report.-
 1
1 -
2
-
3
-
4
-
5
-
6
-
7
-
8
-
9
-
10
-
11
-
12
-
13
-
14
-
15
-
16
-
17
-
18
-
19
-
20
-
21
-
22
-
23
-
24
-
25
-
26
-
27
-
28
-
29
-
30
-
31
-
32
-
33
-
34
-
35
-
36
-
37
-
38
-
39
-
40
-
41
-
42
-
43
-
44
-
 45
45 -
 46
46 -
 47
47 -
 48
48 -
 49
49 -
 50
50 -
 51
51 -
 52
52 -
 53
53 -
 54
54 -
 55
55 -
 56
56 -
 57
57 -
 58
58 -
 59
59 -
 60
60 -
 61
61 -
 62
62 -
 63
63 -
 64
64 -
 65
65 -
66
-
67
-
68
-
69
-
70
-
71
-
72
-
73
-
74
-
75
-
76
-
77
-
78
-
79
-
80
-
81
-
82
-
83
-
84
-
85
-
86
-
87
-
88
-
89
-
90
-
91
-
92
-
93
-
94
-
95
-
96
-
97
-
98
-
99
-
100
-
101
-
102
-
103
-
104
-
105
-
106
-
107
-
108
-
109
-
110
-
111
-
112
-
113
-
114
-
115
-
116
-
117
-
118
-
119
-
120
-
121
-
122
-
123
-
124
-
125
-
126
-
127
-
128
-
129
-
130
-
131
-
132
-
133
-
134
-
135
-
136
-
137
-
138
-
139
-
140
-
141
-
142
-
143
-
144
-
145
-
146
-
147
-
148
-
149
-
150
-
151
-
152
-
153
-
154
-
155
-
156
-
157
-
158
-
159
-
160
-
161
-
162
-
163
-
164
-
165
-
166
-
167
-
168
-
169
-
170
-
171
-
172
-
173
-
174
 |
 |

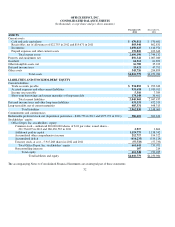
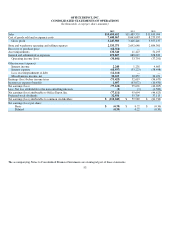
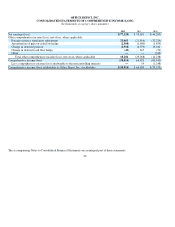
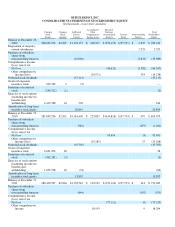
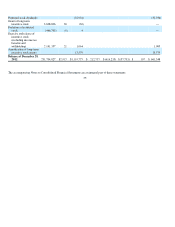
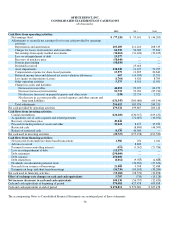
OFFICE DEPOT, INC.
CONSOLIDATED STATEMENTS OF OPERATIONS
(In thousands, except per share amounts)
The accompanying Notes to Consolidated Financial Statements are an integral part of these statements.
53
2012 2011 2010
Sales
$10,695,652
$11,489,533
$11,633,094
Cost of
g
oods sold and occu
p
anc
y
costs
7,448,067
8,063,087
8,275,957
Gross
p
rofit
3,247,585
3,426,446
3,357,137
Store and warehouse o
p
eratin
g
and sellin
g
ex
p
enses
2,535,373
2,692,646
2,684,301
Recover
y
of
p
urchase
p
rice
(68,314)
—
—
Asset im
p
airments
138,540 11,427
51,295
General and administrative ex
p
enses
672,827 688,619
658,832
O
p
eratin
g
income (loss)
(30,841)
33,754
(37,291)
Other income (ex
p
ense):
Interest income
2,240
1,231
4,663
Interest ex
p
ense
(68,937)
(33,223)
(58,498)
Loss on extin
g
uishment of debt
(12,110)
—
—
Miscellaneous income, net
34,225 30,857
34,451
Earnin
g
s (loss) before income taxes
(75,423)
32,619
(56,675)
Income tax ex
p
ense (benefit)
1,697
(63,072)
(10,470)
Net earnin
g
s (loss)
(77,120)
95,691
(46,205)
Less: Net loss attributable to the noncontrollin
g
interests
(9)
(3)
(1,582)
Net earnin
g
s (loss) attributable to Office De
p
ot, Inc.
(77,111)
95,694
(44,623)
Preferred stock dividends
32,934 35,705
37,113
Net earnin
g
s (loss) attributable to common stockholders
$ (110,045)
$ 59,989
$ (81,736)
Net earnin
g
s (loss)
p
er share:
Basic
$ (0.39)
$ 0.22
$ (0.30)
Diluted
(0.39)
0.22
(0.30)