Office Depot 2012 Annual Report Download - page 79
Download and view the complete annual report
Please find page 79 of the 2012 Office Depot annual report below. You can navigate through the pages in the report by either clicking on the pages listed below, or by using the keyword search tool below to find specific information within the annual report.-
 1
1 -
2
-
3
-
4
-
5
-
6
-
7
-
8
-
9
-
10
-
11
-
12
-
13
-
14
-
15
-
16
-
17
-
18
-
19
-
20
-
21
-
22
-
23
-
24
-
25
-
26
-
27
-
28
-
29
-
30
-
31
-
32
-
33
-
34
-
35
-
36
-
37
-
38
-
39
-
40
-
41
-
42
-
43
-
44
-
45
-
46
-
47
-
48
-
49
-
50
-
51
-
52
-
53
-
54
-
55
-
56
-
57
-
58
-
59
-
60
-
61
-
62
-
63
-
64
-
65
-
66
-
67
-
68
-
 69
69 -
 70
70 -
 71
71 -
 72
72 -
 73
73 -
 74
74 -
 75
75 -
 76
76 -
 77
77 -
 78
78 -
 79
79 -
 80
80 -
 81
81 -
 82
82 -
 83
83 -
 84
84 -
 85
85 -
 86
86 -
 87
87 -
 88
88 -
 89
89 -
90
-
91
-
92
-
93
-
94
-
95
-
96
-
97
-
98
-
99
-
100
-
101
-
102
-
103
-
104
-
105
-
106
-
107
-
108
-
109
-
110
-
111
-
112
-
113
-
114
-
115
-
116
-
117
-
118
-
119
-
120
-
121
-
122
-
123
-
124
-
125
-
126
-
127
-
128
-
129
-
130
-
131
-
132
-
133
-
134
-
135
-
136
-
137
-
138
-
139
-
140
-
141
-
142
-
143
-
144
-
145
-
146
-
147
-
148
-
149
-
150
-
151
-
152
-
153
-
154
-
155
-
156
-
157
-
158
-
159
-
160
-
161
-
162
-
163
-
164
-
165
-
166
-
167
-
168
-
169
-
170
-
171
-
172
-
173
-
174
 |
 |

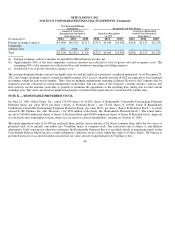
OFFICE DEPOT, INC.
NOTES TO CONSOLIDATED FINANCIAL STATEMENTS (Continued)
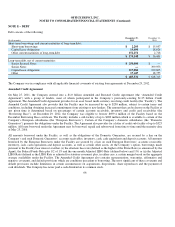
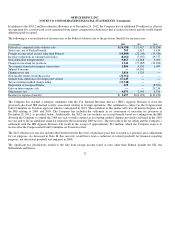
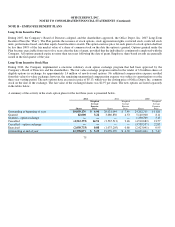
The weighted-average grant date fair values of options granted during 2012, 2011, and 2010 were $1.86, $2.25, and $3.89,
respectively, using the following weighted average assumptions for grants:
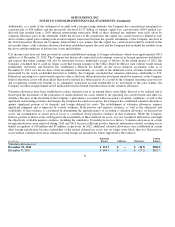
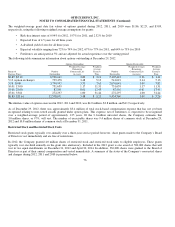
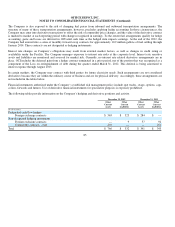
The following table summarizes information about options outstanding at December 29, 2012.
The intrinsic value of options exercised in 2012, 2011 and 2010, was $4.0 million, $3.8 million, and $11.9 respectively.
As of December 29, 2012, there was approximately $3.4 million of total stock-based compensation expense that has not yet been
recognized relating to non-vested awards granted under option plans. This expense, net of forfeitures, is expected to be recognized
over a weighted-average period of approximately 1.25 years. Of the 3.1 million unvested shares, the Company estimates that
3.0 million shares, or 97%, will vest. The number of exercisable shares was 9.4 million shares of common stock at December 29,
2012 and 10.8 million shares of common stock at December 31, 2011.
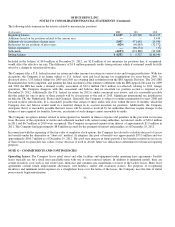
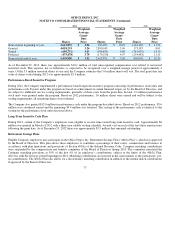
Restricted Stock and Restricted Stock Units
Restricted stock grants typically vest annually over a three-year service period; however, share grants made to the Company’s Board
of Directors vest immediately and are free of restrictions.
In 2012, the Company granted 4.0 million shares of restricted stock and restricted stock units to eligible employees. These grants
typically vest one-third annually on the grant date anniversary. Included in the 2012 grant is one award of 500,000 shares that will
vest in two equal installments on December 31, 2012 and April 30, 2014. In addition, 336,000 shares were granted to the Board o
f
Directors as part of their annual compensation and vested immediately. A summary of the status of the Company’s nonvested shares
and changes during 2012, 2011 and 2010 is presented below.
76
•
Ris
k
-free interest rates of 0.94% for 2012, 1.97% for 2011, and 2.32% for 2010
•
Ex
p
ected lives of 4.5
y
ears for all three
y
ears
•
A dividend
y
ield of zero for all three
y
ears
•
Ex
p
ected volatilit
y
ran
g
in
g
from 72% to 74% for 2012, 67% to 77% for 2011, and 64% to 73% for 2010
•
Forfeitures are antici
p
ated at 5% and are ad
j
usted for actual ex
p
erience over the vestin
g
p
eriod
Options Outstanding Options Exercisable
Range of
Exercise Prices
Number
Outstandin
g
Weighted Averag
e
Remaining
Contractual Life
(in
y
ears)
Weighted
Average
Exercise
Price
Number
Exercisable
Weighted Average
Remaining
Contractual Life
(in
y
ears)
Weighted
Average
Exercise
Price
$0.85 $5.12
6,936,143
3.82
$2.11
5,105,443
3.36
$1.44
5.13 (o
p
tion exchan
g
e)
739,478
3.48
5.13
541,019
3.14
5.13
5.14 10.00
3,790,993
3.55
7.65
2,676,641
3.09
7.83
10.01 15.0
0
751,659
1.17
11.31
751,659
1.17
11.31
15.01 25.0
0
87,501
0.61
17.45
87,501
0.61
17.45
25.01 33.61
272,297
1.00 31.44 272,297
1.00
31.44
$0.85 $33.61
12,578,071
3.48
$5.25
9,434,56
0
3.00
$5.26