Office Depot 2012 Annual Report Download - page 27
Download and view the complete annual report
Please find page 27 of the 2012 Office Depot annual report below. You can navigate through the pages in the report by either clicking on the pages listed below, or by using the keyword search tool below to find specific information within the annual report.-
 1
1 -
2
-
3
-
4
-
5
-
6
-
7
-
8
-
9
-
10
-
11
-
12
-
13
-
14
-
15
-
16
-
 17
17 -
 18
18 -
 19
19 -
 20
20 -
 21
21 -
 22
22 -
 23
23 -
 24
24 -
 25
25 -
 26
26 -
 27
27 -
 28
28 -
 29
29 -
 30
30 -
 31
31 -
 32
32 -
 33
33 -
 34
34 -
 35
35 -
 36
36 -
 37
37 -
38
-
39
-
40
-
41
-
42
-
43
-
44
-
45
-
46
-
47
-
48
-
49
-
50
-
51
-
52
-
53
-
54
-
55
-
56
-
57
-
58
-
59
-
60
-
61
-
62
-
63
-
64
-
65
-
66
-
67
-
68
-
69
-
70
-
71
-
72
-
73
-
74
-
75
-
76
-
77
-
78
-
79
-
80
-
81
-
82
-
83
-
84
-
85
-
86
-
87
-
88
-
89
-
90
-
91
-
92
-
93
-
94
-
95
-
96
-
97
-
98
-
99
-
100
-
101
-
102
-
103
-
104
-
105
-
106
-
107
-
108
-
109
-
110
-
111
-
112
-
113
-
114
-
115
-
116
-
117
-
118
-
119
-
120
-
121
-
122
-
123
-
124
-
125
-
126
-
127
-
128
-
129
-
130
-
131
-
132
-
133
-
134
-
135
-
136
-
137
-
138
-
139
-
140
-
141
-
142
-
143
-
144
-
145
-
146
-
147
-
148
-
149
-
150
-
151
-
152
-
153
-
154
-
155
-
156
-
157
-
158
-
159
-
160
-
161
-
162
-
163
-
164
-
165
-
166
-
167
-
168
-
169
-
170
-
171
-
172
-
173
-
174
 |
 |

OPERATING RESULTS
Discussion of additional income and expense items, including material charges and credits and changes in interest and taxes follows
our review of segment results.
We are currently evaluating changes to the measurement of Division operating income in our management reporting. Under this
consideration, which may be implemented in 2013, a significant amount of costs currently managed at the corporate level could be
allocated to the Divisions and certain allocation methodologies updated. When the analysis is compete, prior period reported
information may be recast for comparison, using updated allocations to prior periods where appropriate.
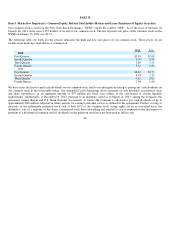
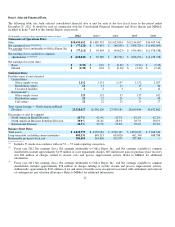
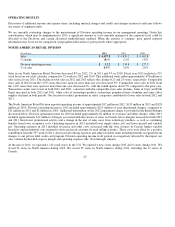
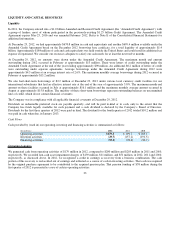
NORTH AMERICAN RETAIL DIVISION
Sales in our North American Retail Division decreased 8% in 2012, 2% in 2011 and 3% in 2010. Fiscal year 2011 included a 53
week based on our retail calendar, compared to 52 weeks in 2012 and 2010. This additional week added approximately $78 million o
f
sales in fiscal year 2011. The decline in total sales in 2012 and 2011 reflects the closing of 23 and 25 stores, respectively. Comparable
store sales in 2012 from the 1,079 stores that were open for more than one year decreased 5%. Comparable store sales in 2011 fro
m
the 1,107 stores that were open for more than one year decreased 2%, with the fourth quarter down 5% compared to the prior year.
Transaction counts were lower in both 2012 and 2011, consistent with the comparable store sales declines. Sales in Copy and Print
Depot increased in both 2012 and 2011, while sales of technology products, technology peripheral items, furniture and some office
supplies declined in both periods. Our decision to reduce promotions in select categories contributed to lower sales in both 2012 and
2011.
The North American Retail Division reported operating income of approximately $12 million in 2012, $135 million in 2011 and $128
million in 2010. Division operating income in 2012 included approximately $123 million of asset impairment charges, compared to
$11 million in 2011 and $2 million in 2010. Additional information on the 2012 impairment charge is provided in the Retail Strategy
discussion below. Division operating income for 2012 included approximately $2 million of severance and other charges, while 2011
included approximately $12 million of charges associated with the closure of stores in Canada. Gross margins increased in both 2012
and 2011 from lower promotional activity and a change in the mix of sales away from technology products, as well as continuing
benefits from lower occupancy costs. Operating expenses in 2012 included lower supply chain costs and lower payroll and variable
pay. Operating expenses in 2011 included severance and other costs associated with the store closures in Canada, higher variable
based pay and incremental costs incurred to drive increased customer focused selling activities. These costs were offset by a positive
contribution from the 53 week in 2011, decreased advertising expenses and other favorable items including benefits recognized fro
m
changes to our private label credit card program. Division operating income in all periods was negatively affected by the impact ou
r
sales volume decline had on gross margin and operating expenses (the “flow through” impact).
At the end of 2012, we operated 1,112 retail stores in the U.S. We opened 4 new stores during 2012 and 9 stores during 2011. We
closed 23 stores in North America during 2012. We closed 25 stores in North America during 2011, including the 12 stores in
Canada.
25
(In millions) 2012 2011 2010
Sales
$ 4,457.8
$ 4,870.2
$ 4,962.8
% chan
g
e
(8)%
(2)%
(3)%
Division o
p
eratin
g
income
$12.2
$134.8
$127.5
% of sales
0.3%
2.8%
2.6%
rd
rd