Office Depot 2012 Annual Report Download - page 94
Download and view the complete annual report
Please find page 94 of the 2012 Office Depot annual report below. You can navigate through the pages in the report by either clicking on the pages listed below, or by using the keyword search tool below to find specific information within the annual report.-
 1
1 -
2
-
3
-
4
-
5
-
6
-
7
-
8
-
9
-
10
-
11
-
12
-
13
-
14
-
15
-
16
-
17
-
18
-
19
-
20
-
21
-
22
-
23
-
24
-
25
-
26
-
27
-
28
-
29
-
30
-
31
-
32
-
33
-
34
-
35
-
36
-
37
-
38
-
39
-
40
-
41
-
42
-
43
-
44
-
45
-
46
-
47
-
48
-
49
-
50
-
51
-
52
-
53
-
54
-
55
-
56
-
57
-
58
-
59
-
60
-
61
-
62
-
63
-
64
-
65
-
66
-
67
-
68
-
69
-
70
-
71
-
72
-
73
-
74
-
75
-
76
-
77
-
78
-
79
-
80
-
81
-
82
-
83
-
 84
84 -
 85
85 -
 86
86 -
 87
87 -
 88
88 -
 89
89 -
 90
90 -
 91
91 -
 92
92 -
 93
93 -
 94
94 -
 95
95 -
 96
96 -
 97
97 -
 98
98 -
 99
99 -
 100
100 -
 101
101 -
 102
102 -
 103
103 -
 104
104 -
105
-
106
-
107
-
108
-
109
-
110
-
111
-
112
-
113
-
114
-
115
-
116
-
117
-
118
-
119
-
120
-
121
-
122
-
123
-
124
-
125
-
126
-
127
-
128
-
129
-
130
-
131
-
132
-
133
-
134
-
135
-
136
-
137
-
138
-
139
-
140
-
141
-
142
-
143
-
144
-
145
-
146
-
147
-
148
-
149
-
150
-
151
-
152
-
153
-
154
-
155
-
156
-
157
-
158
-
159
-
160
-
161
-
162
-
163
-
164
-
165
-
166
-
167
-
168
-
169
-
170
-
171
-
172
-
173
-
174
 |
 |

OFFICE DEPOT, INC.
NOTES TO CONSOLIDATED FINANCIAL STATEMENTS (Continued)
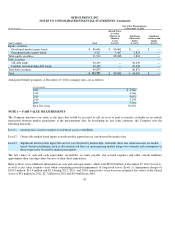
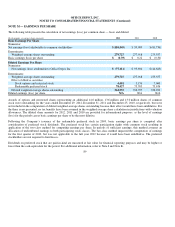
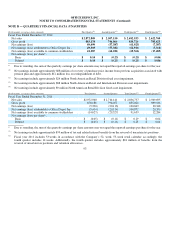
A reconciliation of the measure of Division operating income to Earnings (loss) before income taxes follows.
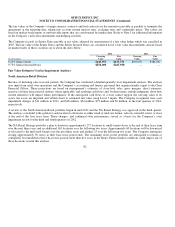
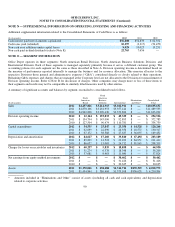
As of December 29, 2012, the Company sold to customers throughout North America, Europe, Asia and Latin America. The
Company operates through wholly-owned and majority-owned entities and participates in other ventures and alliances. There is no
single country outside of the United States in which the Company generates 10% or more of the Company’s total sales. Geographic
financial information relating to the Company’s business is as follows (in thousands).
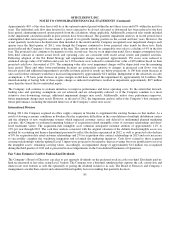
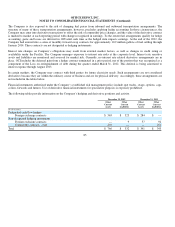
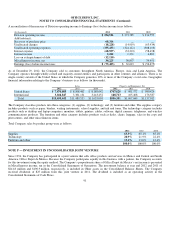
The Company classifies products into three categories: (1) supplies, (2) technology, and (3) furniture and other. The supplies category
includes products such as paper, binders, writing instruments, school supplies, and ink and toner. The technology category includes
products such as desktop and laptop computers, monitors, tablets, printers, cables, software, digital cameras, telephones, and wireless
communications products. The furniture and other category includes products such as desks, chairs, luggage, sales in the copy and
print centers, and other miscellaneous items.
Total Company sales by product group were as follows:
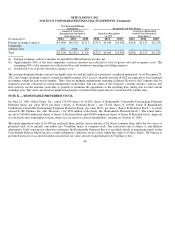
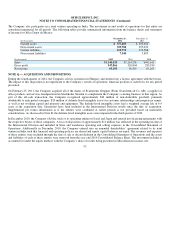
NOTE P — INVESTMENT IN UNCONSOLIDATED JOINT VENTURE
Since 1994, the Company has participated in a joint venture that sells office products and services in Mexico and Central and South
America, Office Depot de Mexico. Because the Company participates equally in this business with a partner, the Company accounts
for this investment using the equity method. The Company’s proportionate share of Office Depot de Mexico’s net income is presented
in Miscellaneous income, net in the Consolidated Statements of Operations. The investment balance at year end 2012 and 2011 o
f
$241.8 million and $196.9 million, respectively, is included in Other assets in the Consolidated Balance Sheets. The Company
received dividends of $25 million from this joint venture in 2011. The dividend is included as an operating activity in the
Consolidated Statements of Cash Flows.
91
(In thousands) 2012 2011 2010
Division o
p
eratin
g
income
$254,526
$372,785
$334,759
Add/(subtract):
Recover
y
of
p
urchase
p
rice
68,314
_
_
__
Unallocated char
g
es
(18,228)
(14,919)
(63,934)
Unallocated o
p
eratin
g
ex
p
enses
(335,453) (324,112)
(308,116)
Interest ex
p
ense
(68,937)
(33,223)
(58,498)
Interest income
2,240
1,231
4,663
Loss on extin
g
uishment of debt
(12,110)
_
_
__
Miscellaneous income, net
34,225
30,857
34,451
Earnin
g
s (loss) before income taxes
$(75,423)
$32,619
$(56,675)
Sales Property and Equipment, Net
2012 2011 2010 2012 2011 2010
United States
$7,670,805
$8,108,402
$8,189,642
$707,628
$901,572
$980,426
International
3,024,847
3,381,131
3,443,452
148,713
165,468
176,587
Total
$10,695,652
$11,489,533
$11,633,094
$856,341
$1,067,040
$1,157,013
2012 2011 2010
Su
pp
lies
65.5%
65.1%
65.2%
Technolo
gy
20.9%
21.9%
22.4%
Furniture and other
13.6%
13.0%
12.4%
100.0%
100.0%
100.0%