Office Depot 2012 Annual Report Download - page 57
Download and view the complete annual report
Please find page 57 of the 2012 Office Depot annual report below. You can navigate through the pages in the report by either clicking on the pages listed below, or by using the keyword search tool below to find specific information within the annual report.-
 1
1 -
2
-
3
-
4
-
5
-
6
-
7
-
8
-
9
-
10
-
11
-
12
-
13
-
14
-
15
-
16
-
17
-
18
-
19
-
20
-
21
-
22
-
23
-
24
-
25
-
26
-
27
-
28
-
29
-
30
-
31
-
32
-
33
-
34
-
35
-
36
-
37
-
38
-
39
-
40
-
41
-
42
-
43
-
44
-
45
-
46
-
 47
47 -
 48
48 -
 49
49 -
 50
50 -
 51
51 -
 52
52 -
 53
53 -
 54
54 -
 55
55 -
 56
56 -
 57
57 -
 58
58 -
 59
59 -
 60
60 -
 61
61 -
 62
62 -
 63
63 -
 64
64 -
 65
65 -
 66
66 -
 67
67 -
68
-
69
-
70
-
71
-
72
-
73
-
74
-
75
-
76
-
77
-
78
-
79
-
80
-
81
-
82
-
83
-
84
-
85
-
86
-
87
-
88
-
89
-
90
-
91
-
92
-
93
-
94
-
95
-
96
-
97
-
98
-
99
-
100
-
101
-
102
-
103
-
104
-
105
-
106
-
107
-
108
-
109
-
110
-
111
-
112
-
113
-
114
-
115
-
116
-
117
-
118
-
119
-
120
-
121
-
122
-
123
-
124
-
125
-
126
-
127
-
128
-
129
-
130
-
131
-
132
-
133
-
134
-
135
-
136
-
137
-
138
-
139
-
140
-
141
-
142
-
143
-
144
-
145
-
146
-
147
-
148
-
149
-
150
-
151
-
152
-
153
-
154
-
155
-
156
-
157
-
158
-
159
-
160
-
161
-
162
-
163
-
164
-
165
-
166
-
167
-
168
-
169
-
170
-
171
-
172
-
173
-
174
 |
 |

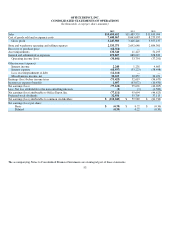
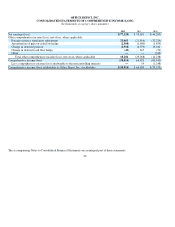
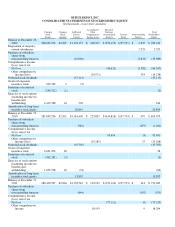
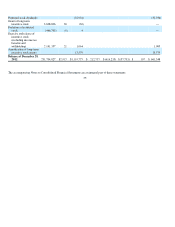
OFFICE DEPOT, INC.
CONSOLIDATED STATEMENTS OF STOCKHOLDERS’ EQUITY
(In thousands, except share amounts)
Common
Stock
Shares
Common
Stock
Amount
Additional
Paid-in
Ca
p
ital
Accumulated
Other
Comprehensive
Income (Loss)
Retained
Earnings
(Accumulated
Deficit)
Treasury
Stock
Noncontrolling
Interest
Total
Stockholders’
E
q
uit
y
Balance at December 26,
2009
280,652,278
$2,807
$1,193,157
$238,379
$(590,195)
$(57,733)
$2,827
$789,242
Disposition of majority-
owned subsidiaries
2,523
2,523
Purchase of subsidiary
shares from
noncontrollin
g
interests
(16,066)
(3,623)
(19,689)
Comprehensive income
(loss), net of tax:
Net loss
(44,623)
(1,582)
(46,205)
Other comprehensive
income (loss)
(14,572)
334
(14,238)
Preferred stock dividends
(37,113)
(37,113)
Grant of long-term
incentive stoc
k
223,762
2
(2)
—
Forfeiture of restricted
stoc
k
(236,512)
(2)
(2)
Exercise of stock options
(including income tax
benefits and
withholdin
g
)
2,419,708
24
59
0
614
Amortization of long-term
incentive stock
g
rants
20,843
20,843
Balance at December 25,
201
0
283,059,236
$2,831
$1,161,409
$223,807
$ (634,818)
$(57,733)
$479
$ 695,975
Purchase of subsidiary
shares from
noncontrollin
g
interests
(983)
(279)
(1,262)
Comprehensive income
(loss), net of tax
Net loss
95,694
(3)
95,691
Other comprehensive
income (loss)
(29,285)
17
(29,268)
Preferred stock dividends
(35,705)
(35,705)
Grant of long-term
incentive stoc
k
2,641,074
26
26
Forfeiture of restricted
stoc
k
(342,281)
(3)
(3)
Exercise of stock options
(including income tax
benefits and
withholdin
g
)
1,072,538
1
0
(74)
(64)
Amortization of long-term
incentive stock
g
rants
13,895
13,895
Balance at December 31,
2011
286,430,567
$2,864
$1,138,542
$194,522
$ (539,124)
$(57,733)
$214
$ 739,285
Purchase of subsidiary
shares from
noncontrollin
g
interests
(444)
(107)
(551)
Comprehensive income
(loss), net of tax
Net loss
(77,111)
(9)
(77,12
0
)
Other comprehensive
income
18,195
9
18,204