Office Depot 2012 Annual Report Download - page 67
Download and view the complete annual report
Please find page 67 of the 2012 Office Depot annual report below. You can navigate through the pages in the report by either clicking on the pages listed below, or by using the keyword search tool below to find specific information within the annual report.-
 1
1 -
2
-
3
-
4
-
5
-
6
-
7
-
8
-
9
-
10
-
11
-
12
-
13
-
14
-
15
-
16
-
17
-
18
-
19
-
20
-
21
-
22
-
23
-
24
-
25
-
26
-
27
-
28
-
29
-
30
-
31
-
32
-
33
-
34
-
35
-
36
-
37
-
38
-
39
-
40
-
41
-
42
-
43
-
44
-
45
-
46
-
47
-
48
-
49
-
50
-
51
-
52
-
53
-
54
-
55
-
56
-
 57
57 -
 58
58 -
 59
59 -
 60
60 -
 61
61 -
 62
62 -
 63
63 -
 64
64 -
 65
65 -
 66
66 -
 67
67 -
 68
68 -
 69
69 -
 70
70 -
 71
71 -
 72
72 -
 73
73 -
 74
74 -
 75
75 -
 76
76 -
 77
77 -
78
-
79
-
80
-
81
-
82
-
83
-
84
-
85
-
86
-
87
-
88
-
89
-
90
-
91
-
92
-
93
-
94
-
95
-
96
-
97
-
98
-
99
-
100
-
101
-
102
-
103
-
104
-
105
-
106
-
107
-
108
-
109
-
110
-
111
-
112
-
113
-
114
-
115
-
116
-
117
-
118
-
119
-
120
-
121
-
122
-
123
-
124
-
125
-
126
-
127
-
128
-
129
-
130
-
131
-
132
-
133
-
134
-
135
-
136
-
137
-
138
-
139
-
140
-
141
-
142
-
143
-
144
-
145
-
146
-
147
-
148
-
149
-
150
-
151
-
152
-
153
-
154
-
155
-
156
-
157
-
158
-
159
-
160
-
161
-
162
-
163
-
164
-
165
-
166
-
167
-
168
-
169
-
170
-
171
-
172
-
173
-
174
 |
 |

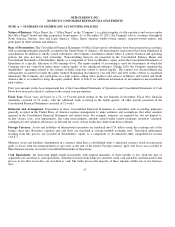
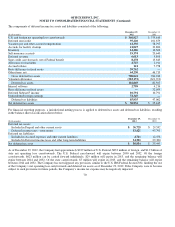
OFFICE DEPOT, INC.
NOTES TO CONSOLIDATED FINANCIAL STATEMENTS (Continued)
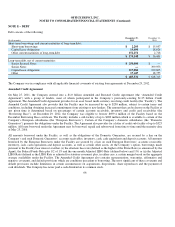
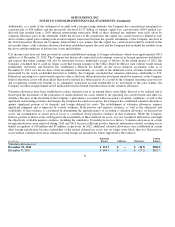
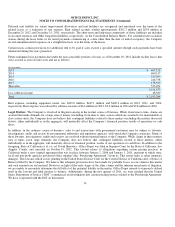
Estimated future amortization expense for the next five years related to capitalized software at December 29, 2012 is as follows:
The weighted average amortization period for the remaining capitalized software is 3.6 years.
In 2010, the Company recognized a $51.3 million asset impairment associated with the abandonment of a certain capitalized software
application. This asset impairment is included in Asset impairments in the Consolidated Statement of Operations.
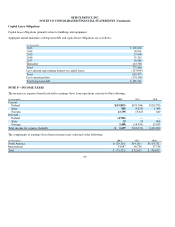
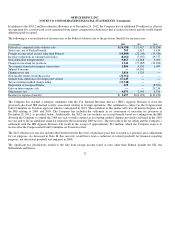
NOTE D – GOODWILL AND OTHER INTANGIBLE ASSETS
Goodwill
The components of goodwill by segment are provided in the following table:
Refer to Note I for additional discussion of the 2012 goodwill valuation considerations.
64
(In millions)
2013
$49.4
2014
47.8
2015
43.4
2016
18.7
2017
6.3
Thereafter
0.1
(In thousands)
North
American
Retail
Division
North
American
Business
Solutions
Division
International
Division Total
Goodwill
$1,842
$367,790
$863,134
$1,232,766
Accumulated im
p
airment losses
(1,842)
(348,359)
(863,134)
(1,213,335)
Balance as of December 25, 2010
—
19,431
—
19,431
Goodwill
1,842
367,790
863,134
1,232,766
Accumulated im
p
airment losses
(1,842)
(348,359)
(863,134)
(1,213,335)
Goodwill ac
q
uired durin
g
the
y
ear
__
__
45,805
45,805
Forei
g
n currenc
y
rate im
p
act
__
__
(3,337)
(3,337)
Balance as of December 31, 2011
—
19,431
42,468
61,899
Goodwill
1,842
367,790
905,60
2
1,275,234
Accumulated im
p
airment losses
(1,842)
(348,359)
(863,134)
(1,213,335)
Forei
g
n currenc
y
rate im
p
act
—
_
_
2,413
2,413
Balance as of December 29, 2012
$
—
$19,431
$ 44,881
$ 64,312